Scores tables
Anticipating customer behavior rather than reacting to it is a key driver for maximizing customer lifetime value. Thanks to the scoring add-on, Actito empowers marketers with machine-learning-driven KPIs directly inside your data model.
By calculating metrics such as churn probability, anticipated order frequency, and expected future revenue, this add-on enables you to anticipate customer (profile) intent, tailor your offers, and trigger automated retention or VIP journeys at the exact right moment.
The scoring add-on requires setup on your license. To enable this feature, please contact your account manager.
Overview
When the add-on is activated for your license, a new dedicated custom table "Scores" is automatically created and linked to your profile table.
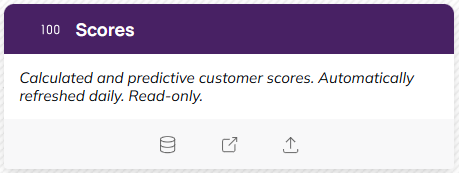
To ensure maximum simplicity and data integrity, the Scores table operates as an automated data structure:
- Read-only native table: the Scores table cannot be manually edited or modified via the interface. It is dedicated strictly to scores.
- 1-to-1 relationship: each profile of your profile table is linked to one row in the Scores table, holding their latest computed metrics.
- Automated daily refresh: once data retrieval is activated on your license, the table is automatically refreshed on a daily basis with the latest predictive calculations.
- No technical setup for you: you do not have to build, map, or train algorithms. The only step required on your side is to choose the predictive attributes you wish to track among the available in the list.
The predictive model continuously analyzes your data. A minimum history of 120 days of interaction/purchase data is required to compute reliable predictive scores.
Available predictive attributes
Depending on your marketing strategy and objectives, you can select the attributes you want to include in your Scores table.
Each attribute comes in two forms:
-
Absolute value attributes give you the raw number (monetary amount, count of orders, number of days, or probability). Use these when you want to filter on a concrete threshold (for example, profiles with a historic value above €500).
-
Percentile attributes rank each profile from 0 to 100 against the rest of your profiles on the same underlying metric. You can use these when you want to target a relative slice of your audience (i.e. the 10 % of profiles with the highest historic value all time) without having to know what the absolute cutoff is. A value of 90 means the profile is in the top 10 %.
For percentiles, a high score always reflects positive customer behavior. For metrics where a low raw number is preferable (recency, time between purchases, inactivity score, churn risk), the scale is automatically inverted: a percentile score close to 100 will always correspond to the most virtuous or most engaged profile.
Absolute value attributes
- Repurchase probability: represents the probability of the profile placing a new order at any time in the future. It is the opposite of churn, but churn can be calculated on the basis of repurchase probability with this formula: Churn = 100 - 'repurchase probability'.
- This attribute is a prediction by the AI model based on the number of orders (Frequency), days since last order (Recency), days since first order (Time), the personal "average days between orders" for the customer and the dropout rate for the shop (which is an internal value predicted by the model, shop specific and that represents the ability to keep customers coming back). For example: If a customer has a repurchase probability of 75 %, its churn risk is 25 %.
- Churn risk: the inverse of repurchase probability that tells you how likely it is that the profile will churn
- Historic value last 365 days: sum of the value of all orders by the profile during the last 365 days
- Historic value all time: sum of the value of all orders by the profile
- Predicted future value next 365 days: is based on predicted number of orders in the next 365 days and average order value.
- Predicted Customer Lifetime Value: sum of historic value and future value for the next 365 days for the profile.
- Predicted number of orders next 365 days: prediction by the AI model and tells you how many times a profile will place an order within the next 365 days. It is based on the profile's buy frequency and the predicted alive score.
- Days since first order: number of days since the first order by the profile.
- Days since last order (= recency): number of days since the last order by the profile.
- Number of orders (= frequency): number of orders a profile has placed (multiple items bought on the same day are aggregated into one order).
- Average order value (= monetary value): average value of the basket (multiple items bought on the same day are aggregated into one order), calculated by dividing the total historical value by the number of orders.
- Average days between orders: number of days between the first and last order divided by the number purchases minus one. For example: 3 orders in 100 days (first order on day 0, last order on day 100) equals 50 days between orders on average.
- Inactivity score: Days since the profile placed its last order divided by the average days between orders for that profile (requires at least 2 orders). On the day a profile places an order, this score will be 0. Until the same profile buys again and has not reached its personal buying average, the inactivity score will be between 0 and 100. If the profiles exceeds its personal buying average, the number will be more than 100. For example: If a profile places an order every 10 days in average, but today it is 15 days since he last placed an order, the inactivity score will be 150.
Percentile attributes
Each percentile attribute is a 0 to 100 ranking of the profile against the rest of the profile table on the matching absolute attribute (where 0 is the bottom of the distribution & 100 is the top). The label on each attribute tells you what "higher" means (so no need to remember whether a high raw number is good or bad for that metric). The recency, days-between-orders, inactivity and churn risk percentiles invert their source value so that higher always means better profile behavior.
- Repurchase probability, percentile: ranks each profile from 0 to 100 by how likely they are to place another order. A higher score means the profile is more likely to buy again (100 is the most loyal, 0 the least).
- Historical value last 365 days, percentile: ranks each profile from 0 to 100 by how much they have spent in the past year. A higher score means the profile has spent more than most others (100 is your top spender over the last 365 days).
- Historical value all time, percentile: ranks each profile from 0 to 100 by total lifetime spend with you. A higher score means the profile has spent more overall (100 is your highest-spending profile to date).
- Predicted future value next 365 days, percentile: ranks each profile from 0 to 100 by how much the AI model expects them to spend over the coming year. A higher score means the profile is predicted to spend more than most others.
- Predicted customer lifetime value, percentile: ranks each profile from 0 to 100 by predicted total value (past spend plus expected spend over the next year). A higher score means the profile is among your most valuable overall.
- Predicted number of orders next 365 days, percentile: ranks each profile from 0 to 100 by how many orders the AI model expects them to place in the coming year. A higher score means the profile is predicted to order more often than most others.
- Days since first order (customer age), percentile: ranks each profile from 0 to 100 by how long they have been a profile. A higher score means the profile has been with you longer (100 is among your longest-standing profiles, 0 is a brand-new one).
- Days since last order (recency), percentile: ranks each profile from 0 to 100 by how recently they last ordered. A higher score means the profile ordered more recently. This percentile flips the raw metric, because a lower number of days since last order is the better outcome.
- Number of orders (order frequency), percentile: ranks each profile from 0 to 100 by how many orders they have placed in total. A higher score means the profile has ordered more times than most others.
- Average order value, percentile: ranks each profile from 0 to 100 by the average size of their basket. A higher score means the profile typically spends more per order than most others.
- Average days between orders (purchase frequency), percentile: ranks each profile from 0 to 100 by how often they buy. A higher score means the profile buys more frequently. This percentile flips the raw metric, because a smaller gap between orders is the better outcome.
- Inactivity score (activity recency), percentile: ranks each profile from 0 to 100 by how active they are relative to their own buying rhythm. A higher score means the profile is well within/head of their normal buying cycle. This percentile flips the raw metric, because a lower inactivity score is the better outcome.
- Churn risk (retention), percentile: ranks each profile from 0 to 100 by how likely they are to stick around. A higher score means the profile is less likely to churn. This percentile flips the raw metric, because a lower churn risk is the better outcome.
The predictive engine requires at least 120 days of historical data to train the model and compute consistent scores. For new or inactive contacts without sufficient purchase history, default baseline indicators will apply until adequate interaction data is accumulated.
Leverage your daily predictive scores across your targeting and scenarios:
- Protect VIP revenue: combine high Predicted CLV with rising Churn risk to trigger automated retention offers before contacts lapse.
- Optimal re-engagement: target profiles with an inactivity score > 100 to reach them the exact moment they exceed their typical buying rhythm.
- Protect margins: suppress discounts for profiles with a high Repurchase probability who are already likely to buy organically.