Scenario report
Once a scenario is active or finalized, it is possible at anytime to access a report presenting the performance of this scenario and to analyze the path taken by profiles at a global level.
Date Filter
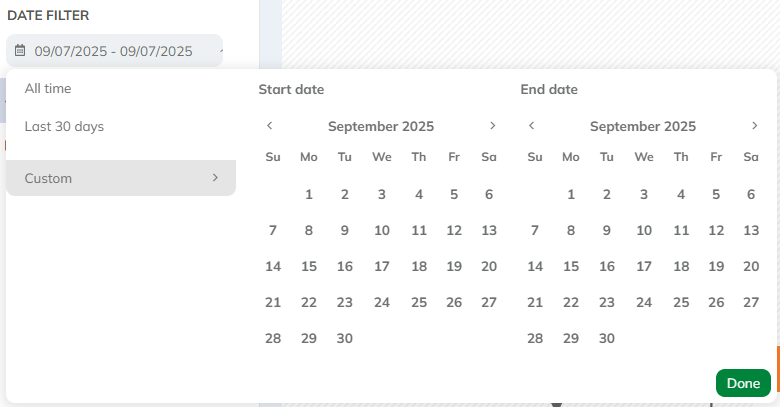
By default, the date filter is set to display the results of executions that started within the last 30 days. You can change how these results are displayed by either choosing to show all executions since the scenario was created (select all time) or by selecting a specific time period (start date and end date).
All scenario result data will automatically be recalculated for the selected period.
Scenario Status Details

Below the date filter, you will find details about:
- The activation moment: the date and time the scenario was activated
- The finalization moment: the date and time of the last scenario execution
- The stop moment: the date and time the scenario was stopped
Preview
In this tab, you can view your scenario. You also have the option to filter this preview based on a segment, language, or gender.

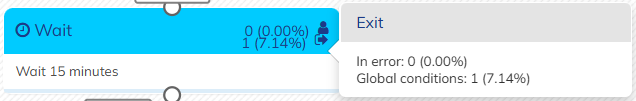
For each block, the number of people who passed through that step of the scenario is shown. The percentage indicates the proportion of the population that entered the scenario during the analysis period and passed through the corresponding block.
For waiting blocks, the number of profiles for which the waiting period is not yet over is displayed.

When a global exit condition has been configured, the report may indicate what triggered the scenario to stop at a particular block, or if an error occurred.
Summary
You can also access a summary report of your scenario. Here too, you can filter the preview based on a segment, language, or gender.

Number of executions & conditions
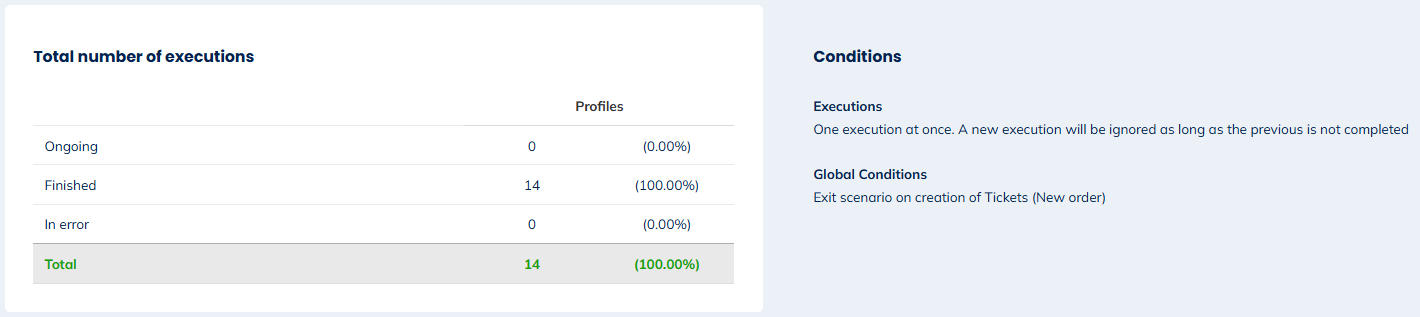
The number of executions report shows how many profiles are present at each stage:
- Ongoin: Number of profiles still at one of the scenario steps
- Finished: Number of profiles that reached the final (or one of the final) steps of the scenario
- In error: Number of profiles that exited the scenario due to an error
The conditions report displays the definitions of global exit conditions and execution limit settings that may have been configured for the scenario.
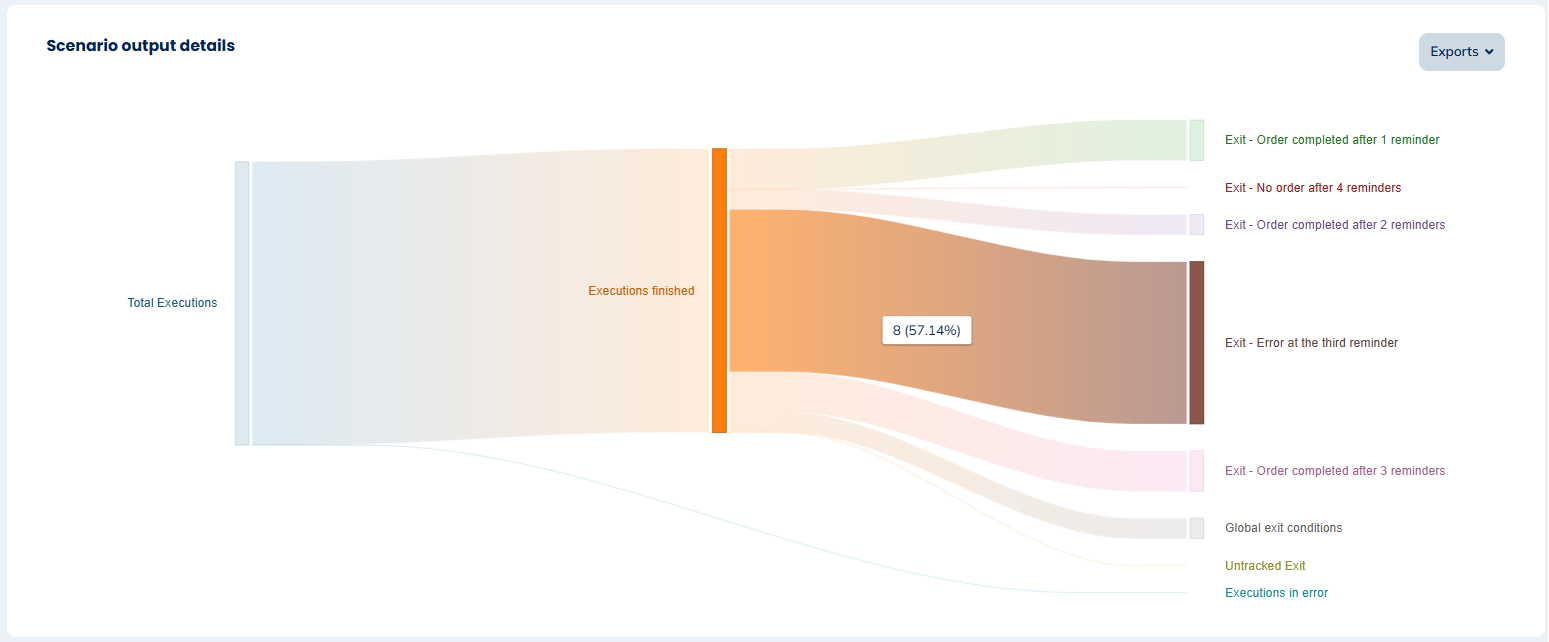
Scenario output details
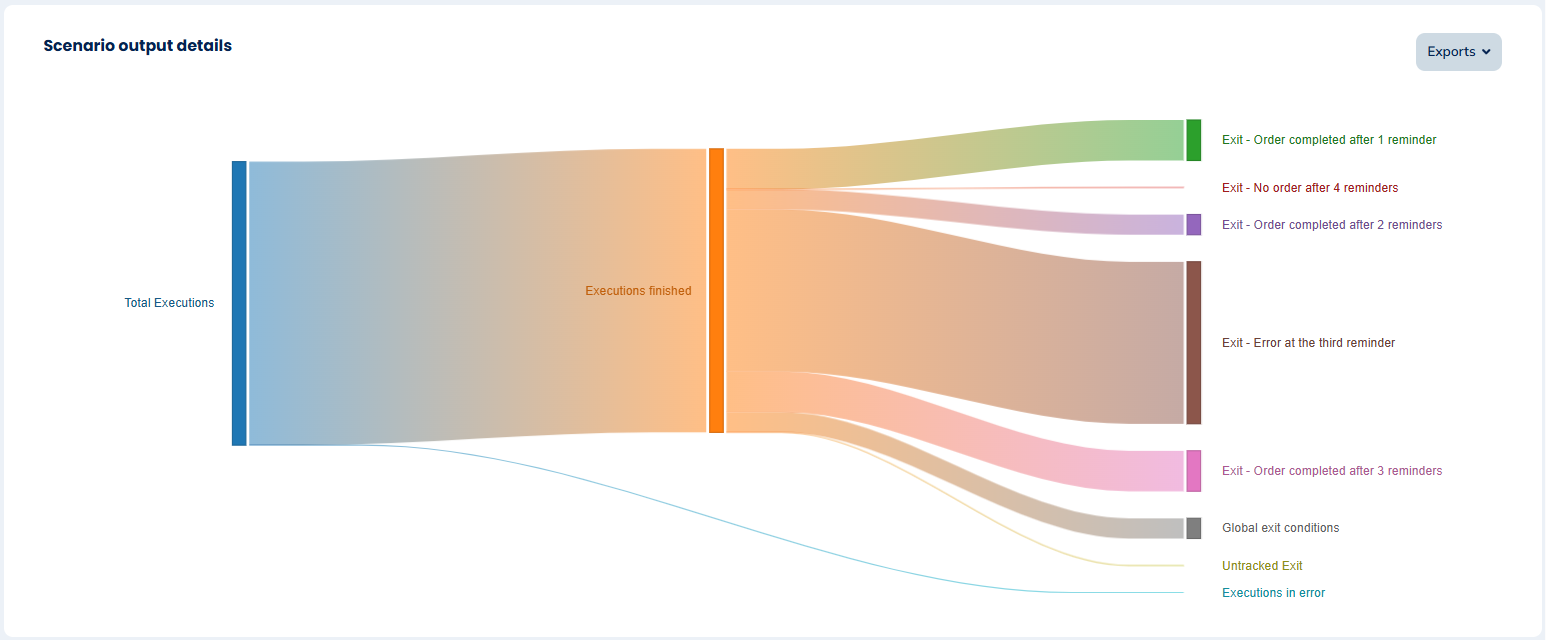
The chart showing scenario output details provides an at-a-glance view of scenario executions. Four types of exits are displayed:
- Exits through exit blocks, where a designated exit block was used
- Exits through global exit conditions
- Untracked exits, where no exit block was used
- Executions in error, which represent profiles that exited due to an error
The names shown in the chart are those defined during the scenario creation in the exit blocks. Note that if you use the same name for multiple exit blocks, they will be grouped together in the chart.
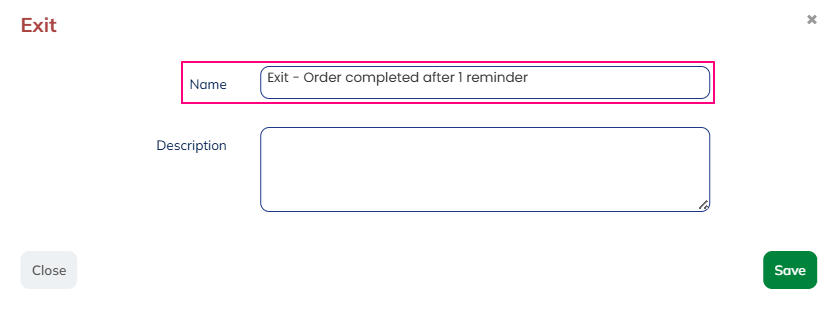
To ensure the full name of the exit block is visible in the report, we recommend not exceeding 60 characters.
By hovering your mouse over a block, you can view the absolute number of profiles that exited through that path, along with the percentage (number of exited profiles/number of finished executions):
You can export this chart in three formats:
- An .svg file
- A .csv file
- Print the chart as is
Analyzing the profile's path
To find the specific path followed by a profile within a scenario, you will have to access the file of the profile in question.
Go to the Profiles app (Apps > Profiles > Profiles).

After finding the profile you are interested in, click on 'View' to reach the details of the file then go to the ‘Interaction’ tab.
Find the relevant scenario in this interaction list. The entry will have an orange icon next to it:

Next, click on the eye to see the data related to the interaction with this scenario. You will have to click on ‘details’ to see the exact path followed by the profile in this scenario. The date and hour on which the profile went through each step will also be displayed.