Email report
You can access your email campaign reports through different ways. The first option is to use the dedicated app called 'E-mail campaigns reports' (Apps > Reporting > E-mail campaigns reports).

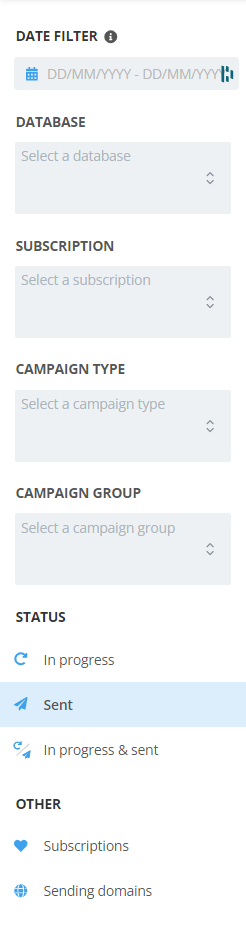
This app allows you to filter your reports by date, profile table(s), subscription(s), campaign type, campaign group, campaign status (In Progress and/or Sent), subscription or sending domain.
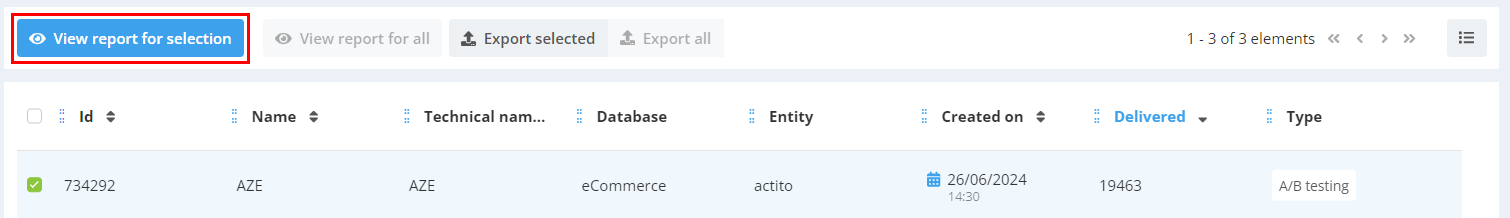
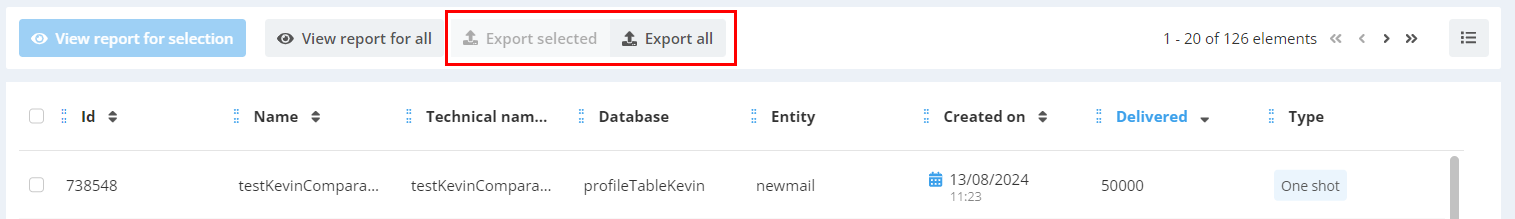
To access the campaign report, simply select the campaign(s) for which you wish to view the report and click on 'View report for selection'.
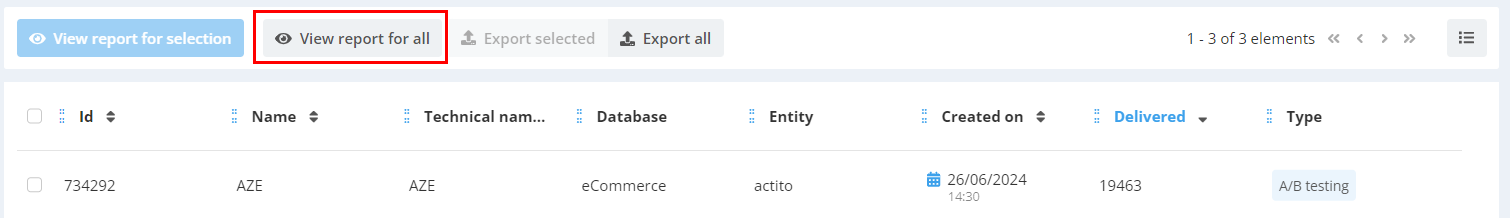
You can also view the report for all campaigns matching your filter criteria by clicking on the 'View report for all' button.
By choosing to view the report for all or several campaigns, you will have an aggregated report with data from all the campaigns selected. You will not have access to the usual reporting tabs, but two specific tabs: a summary tab and a 'Comparison' tab allowing you to compare the impact of your campaigns.
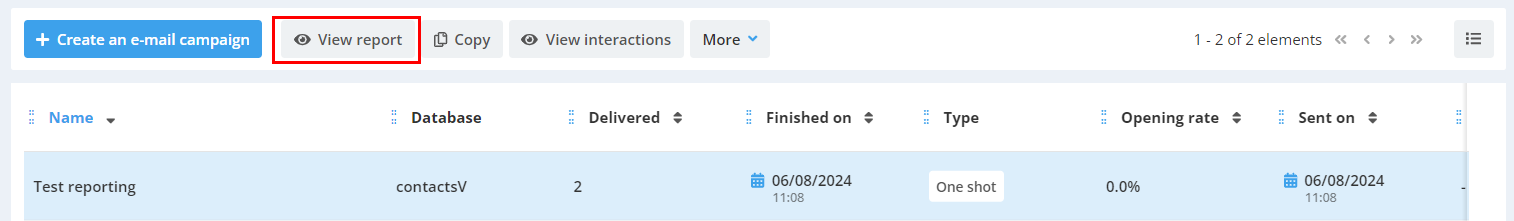
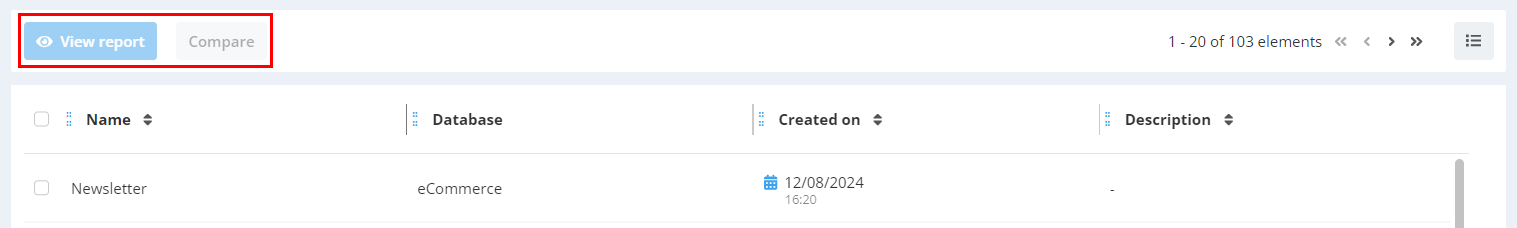
If you want to view a single campaign report, you can also access your campaign report directly through the 'E-mail campaigns' app (Apps > E-mail campaigns > E-mail campaigns). Select the relevant campaign and click on "View report". Remember that reports are only available for 'In progress' or 'Sent' campaigns.
Understanding the filter menu
The reporting menu gives you information on all campaigns started, finished, in error or cancelled. And also scenarized campaigns for which there has been at least one interaction.
When you use the date filter, you will have :
- scenarized campaigns for which there has been at least one interaction during the selected period
- one-shot campaigns corresponding to the filters and for which there has been at least one interaction during the chosen period (for example: start date before the end of the period and end date (if any) after the start date).
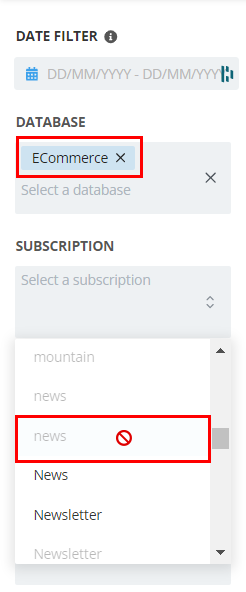
You can filter the In progress/Sent campaigns using several filters at the same time. And, for each of the filter, filter on more than one elements.
For example, for the sent campaigns, you can filter scenarized campaigns sent to two databases and to the ‘newsletter’ subscription of each database.
If you filter your campaigns according to one or more specific databases and wish to add a filter on subscriptions as well, you will only be able to select subscriptions linked to these databases. Subscriptions belonging to other databases will be grayed out and will be unclickable.
Understanding email campaign reports
In Actito reports, different types of information are included, namely, information on targeting, opening and click rates, deliverability, and a general summary of your sending results.
Reminder : these tabs are visible for full reports only. This means that if you wish to see the aggregated report of several campaigns, you will see the summary tab and a comparison tab.
The information is organized in different tabs. You can navigate though them thanks to the left menu.

1. The summary tab
The Summary tab will be your welcome interface to the reporting app. At the right side of the screen, you will see a graph representing your rates of sent, delivered, opened and clicked emails.
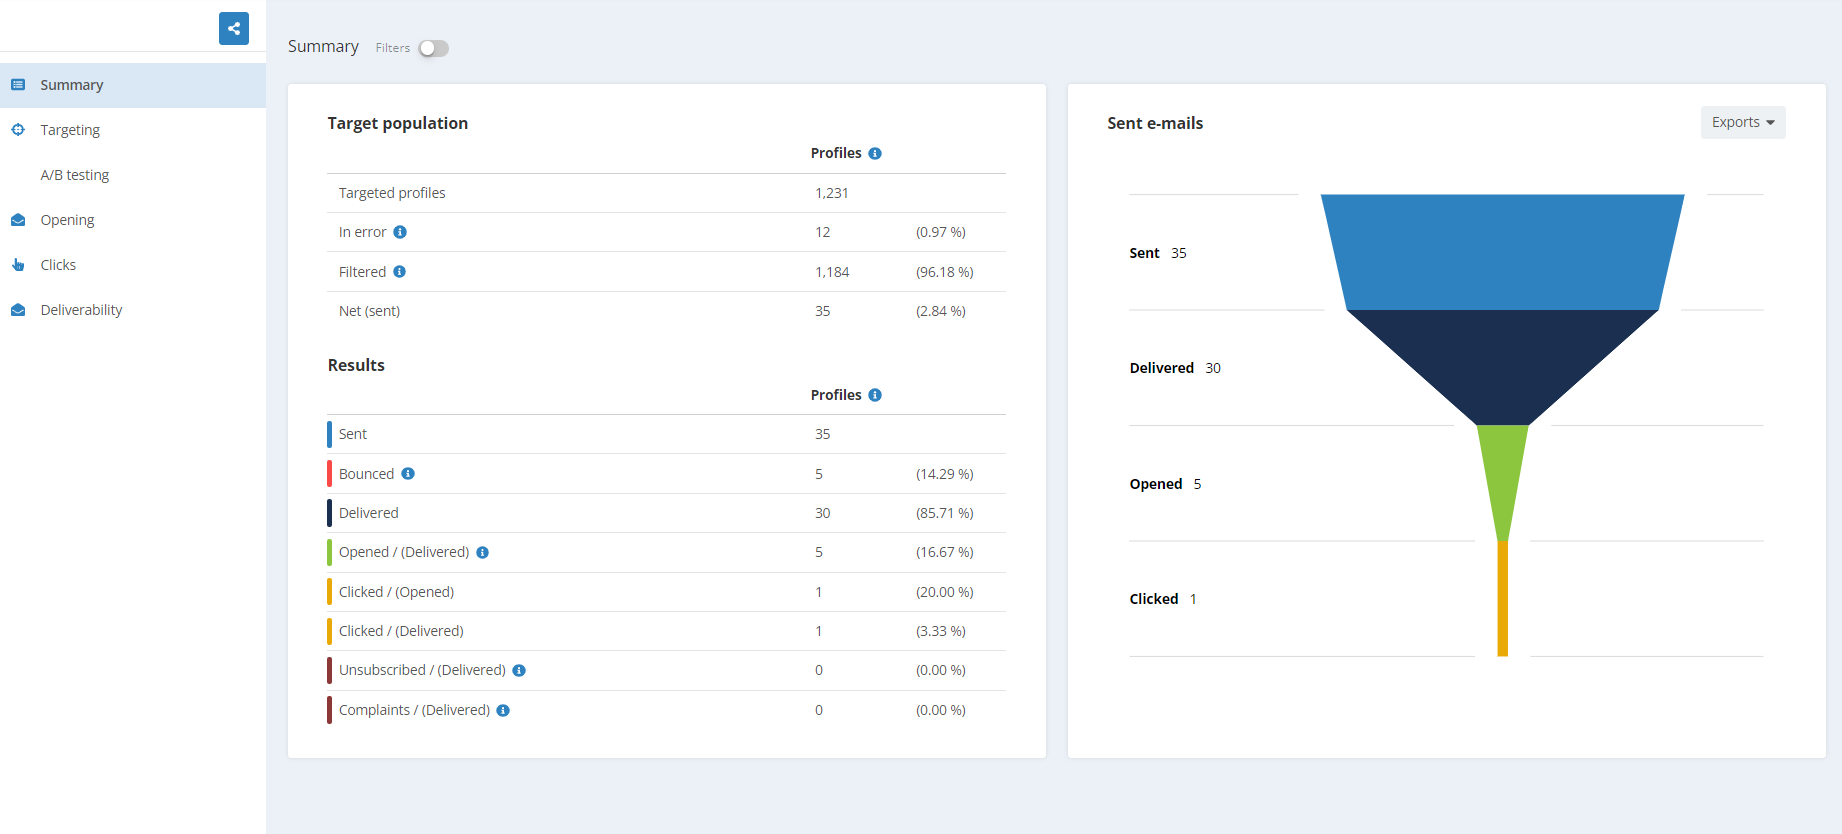
Whenever you see the 'Exports' button, you can print or download the graph.

At the left side of the screen, you will see a series of tables:
1. Table of campaign information
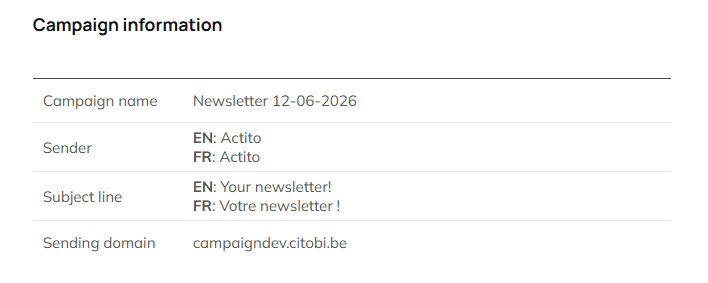
You will see information about your campaign:
- Campaign name = the name given to the campaign in the interface
- Sender = the sender defined at step 1 of the campaign which appeared in the inbox of the recipient of your e-mail (the 'from')
- Subject line = the object of your e-mail campaign. For multilingual campaigns, you will find the subject for each language
- Sending domain = the sending domain used to shoot the campaign
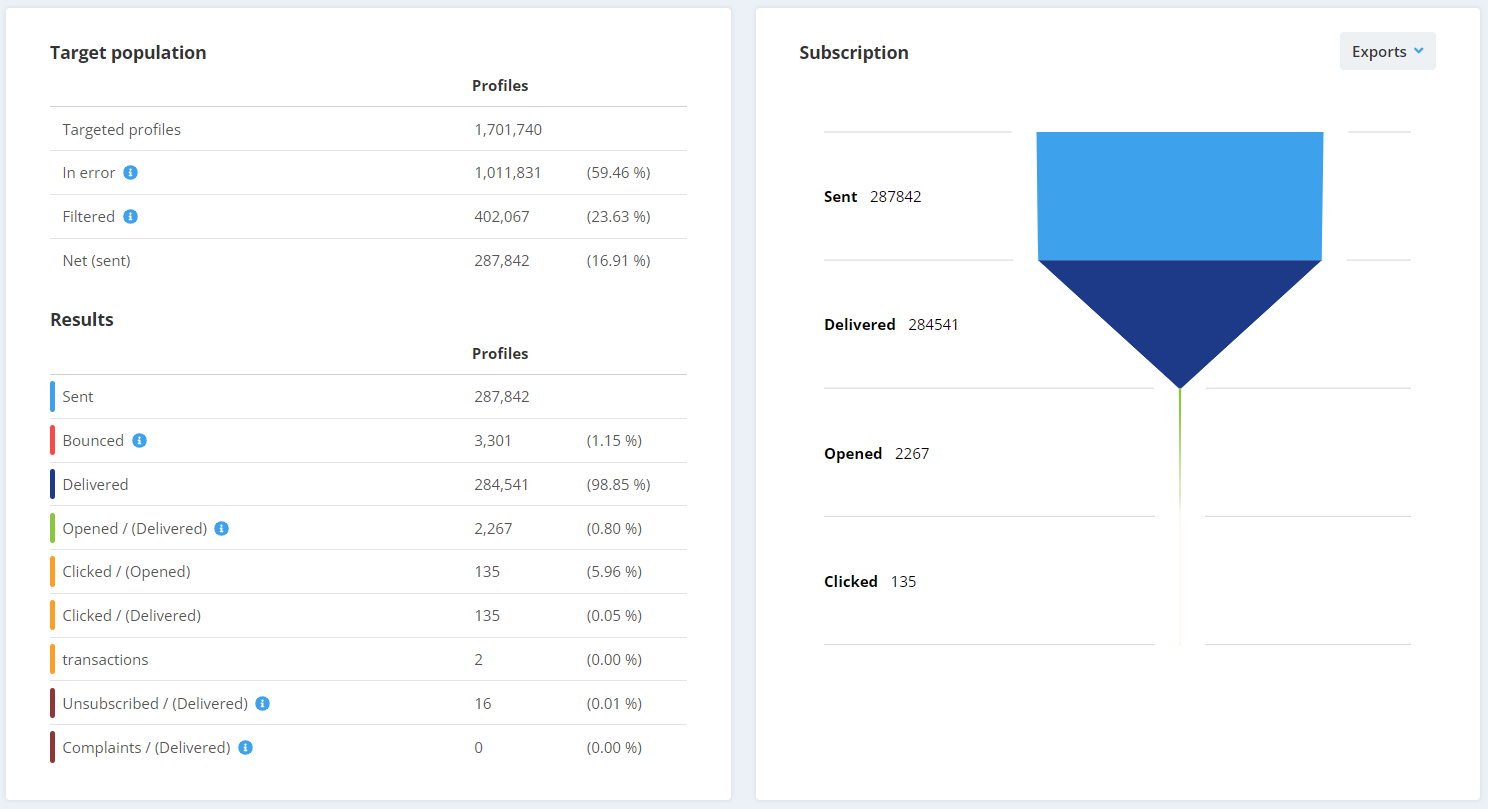
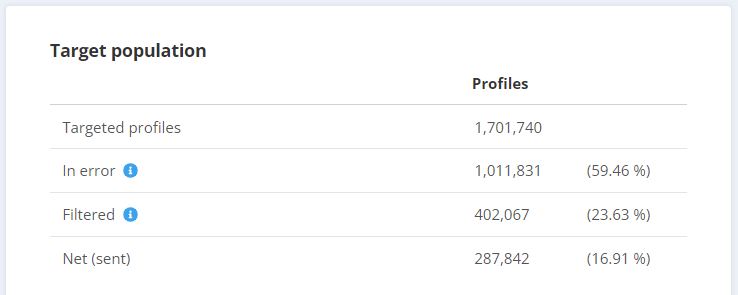
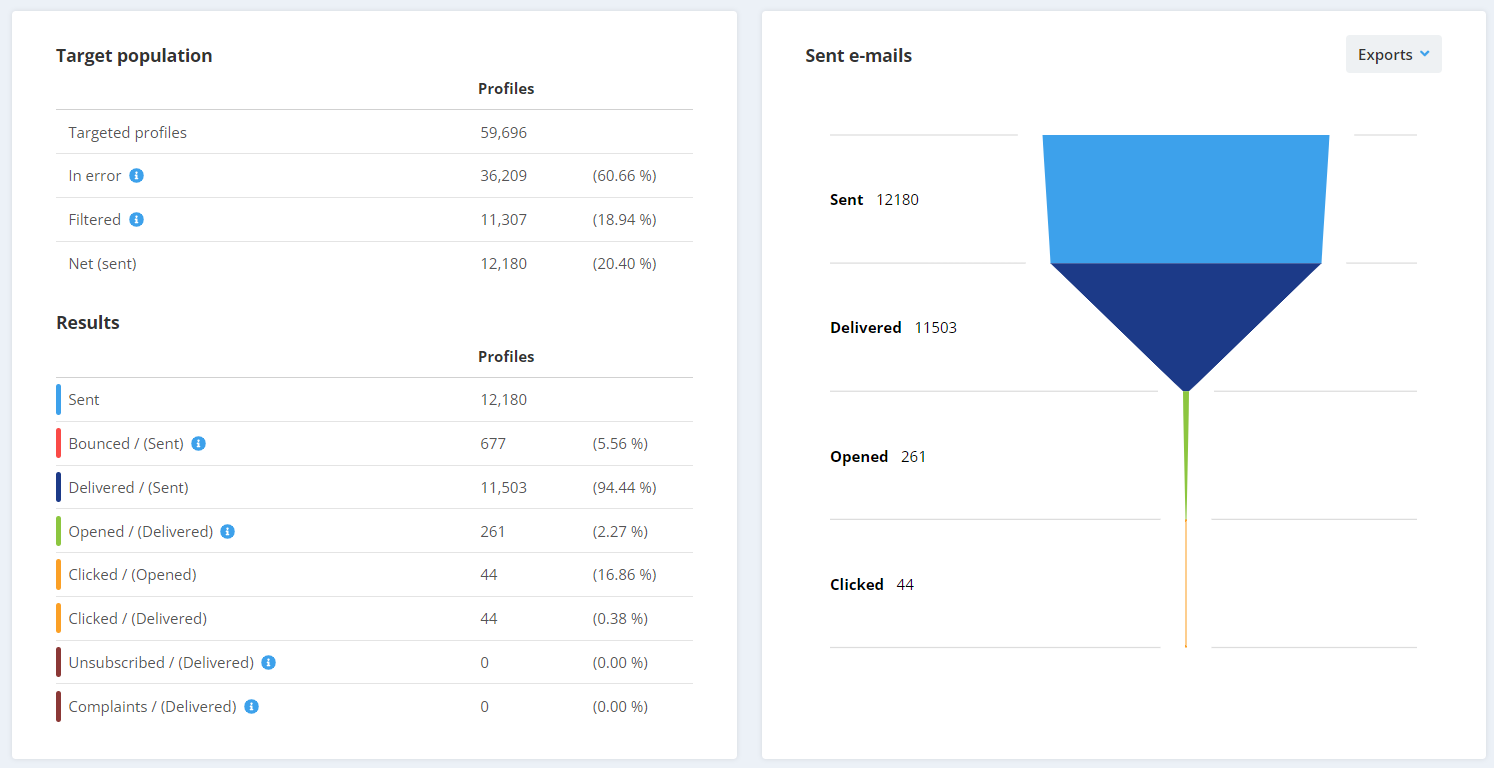
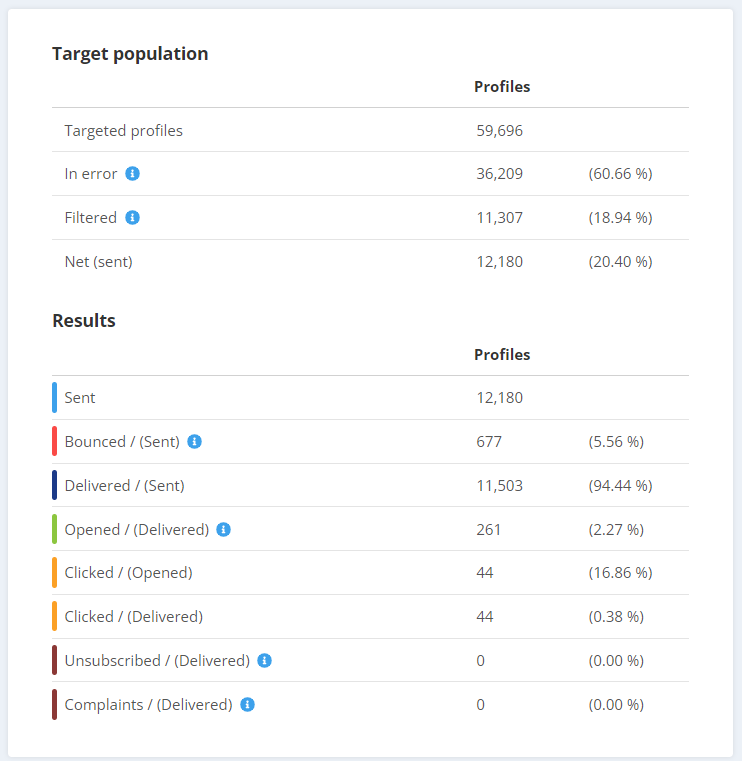
2. Table of data on the target group
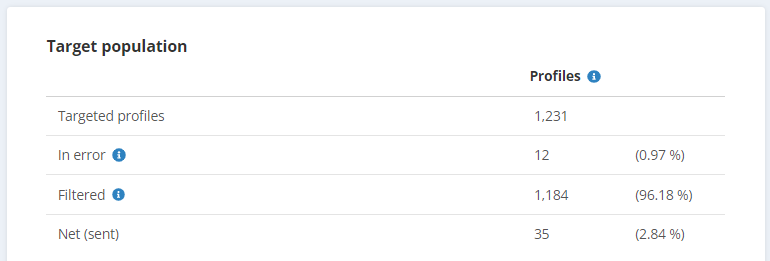
You will observe different statuses in this table:
- Targeted profiles = number of profiles in the target
- In error = number of profiles for which the email could not be sent due to an error
- Error when routing the email
- Error when generating an email (e.g. with its personalization, with the rendering of the HTML...)
- Error in one of the parameters of the email
- The target profile is not part of the profile table linked to the email campaign
- The target profile is not part of the targeting of the mailing
- Error of a personalization value
- Limit of non-filtered profiles is reached (for transactional emails)
- Definition of the target of the email campaign is invalid
- Filtered = number of profiles filtered by the Smart filter
- The target profile has no email address
- The profile email address is known, but syntactically invalid
- A duplicate email address
- A complaint has been recorded by a profile
- The domain name of the email address is part of a list of service domain names updated by Actito's deliverability team
- The commercial pressure was activated for this profile
- The email address is temporary quarantined due to encountering bounces. This quarantine is temporary because Actito thinks it is still possible to contact this email address.
- The email address is quarantined permanently due to encountering hard bounces. Actito considers it is not possible to contact this email address anymore and will not try again.
- The email exceeds the maximum size of 4MB set up in order to optimize the inbox loading time
- The profile was randomly filtered in the control group of the campaign
- Net (sent) = number of profiles who did receive the email
This table compares the numbers of these four categories. Each profile is counted only once (unique number).
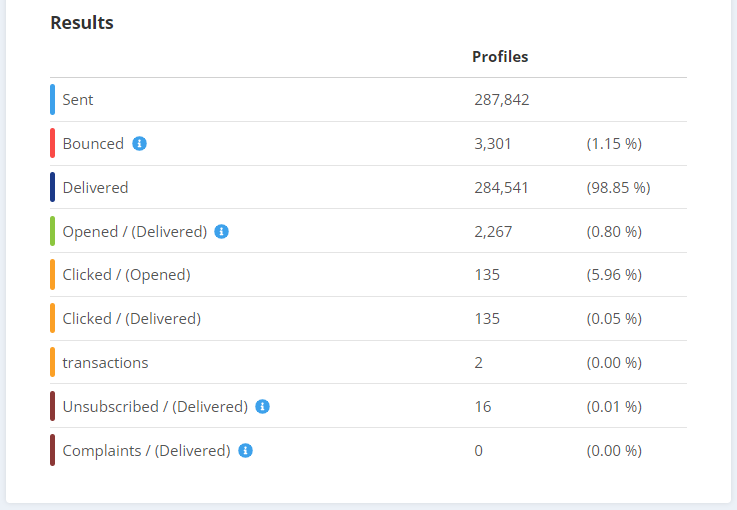
3. Table of data on the campaign results
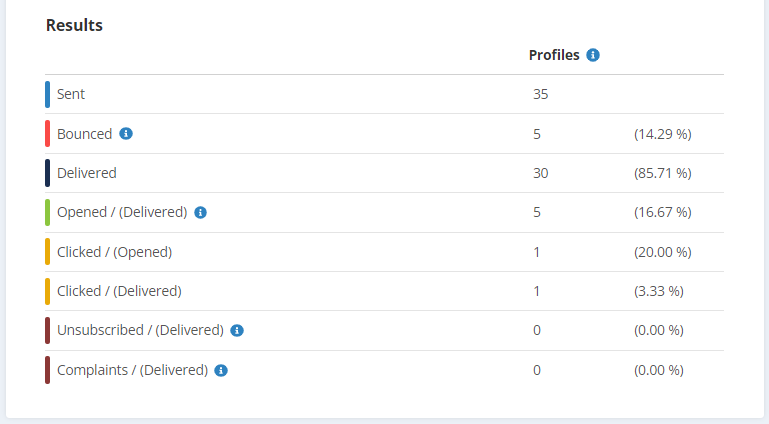
Here again, you will observe different statuses:
- Sent = number of emails that are sent
- Bounced = number of emails that have bounced
- Delivered = number of emails that have been delivered
- Opened/(Delivered) = number of emails that were opened out of the number delivered
Openings are recorded when the images are downloaded, thanks to a tracking pixel, or when a click is recorded (see specificities for Apple iOS 15)
Only the first opening is recorded.
- Clicked/(Opened) = number of emails that were clicked out of the number opened
- Clicked/(Delivered) = number of emails that were clicked out of the number delivered
Clicks are recorded thanks to the redirection through your branded link domain.
Only the first click is recorded.
- Unsubscribed/(Delivered) = number of emails that were unsubscribed out of the number delivered
- Complaints/(Delivered) = number of emails that were marked as spam out of the number delivered
As in the previous table, profiles are counted only once.
If a profile only clicks on the Webversion or Unsubscribe link, the e-mail does not count as 'clicked'.
Using filters
It is also possible to obtain more precise results thanks to filters. These are availble in the summary, openings and deliverability tabs. For example, you can view the results of the profiles depending on the segment they belong to, the language they speak or their gender. For that, switch on the filter in the upper part of the screen and choose your wished action.

It should be noted that the report takes into account the segment, the language and the gender at the time the campaign was sent. It does not take into account changes made retroactively.
2. The targeting tab
In this tab you can review the targeting conditions that were defined for the campaign.
3. Openings tab
In this tab, you will find information on the opening rates of your sending.
The first table that you will see in this tab offers you a comparison between the total number of opened emails, the percentage of delivered and sent emails, and the percentage of profiles targeted.
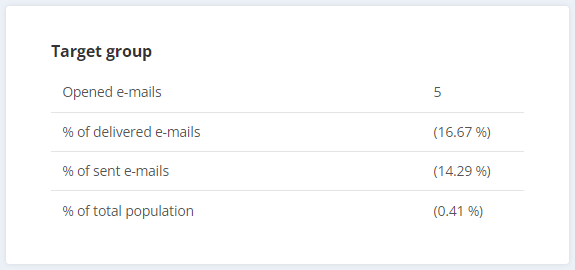
The percentage of delivered emails is the result of the number of targeted profiles MINUS the number of emails filtered by the Spam Filter, the number of emails in error and the number of bounces.
The percentage of sent emails is the result of the number of targeted profiles MINUS the number of filtered emails and the number of emails in error.
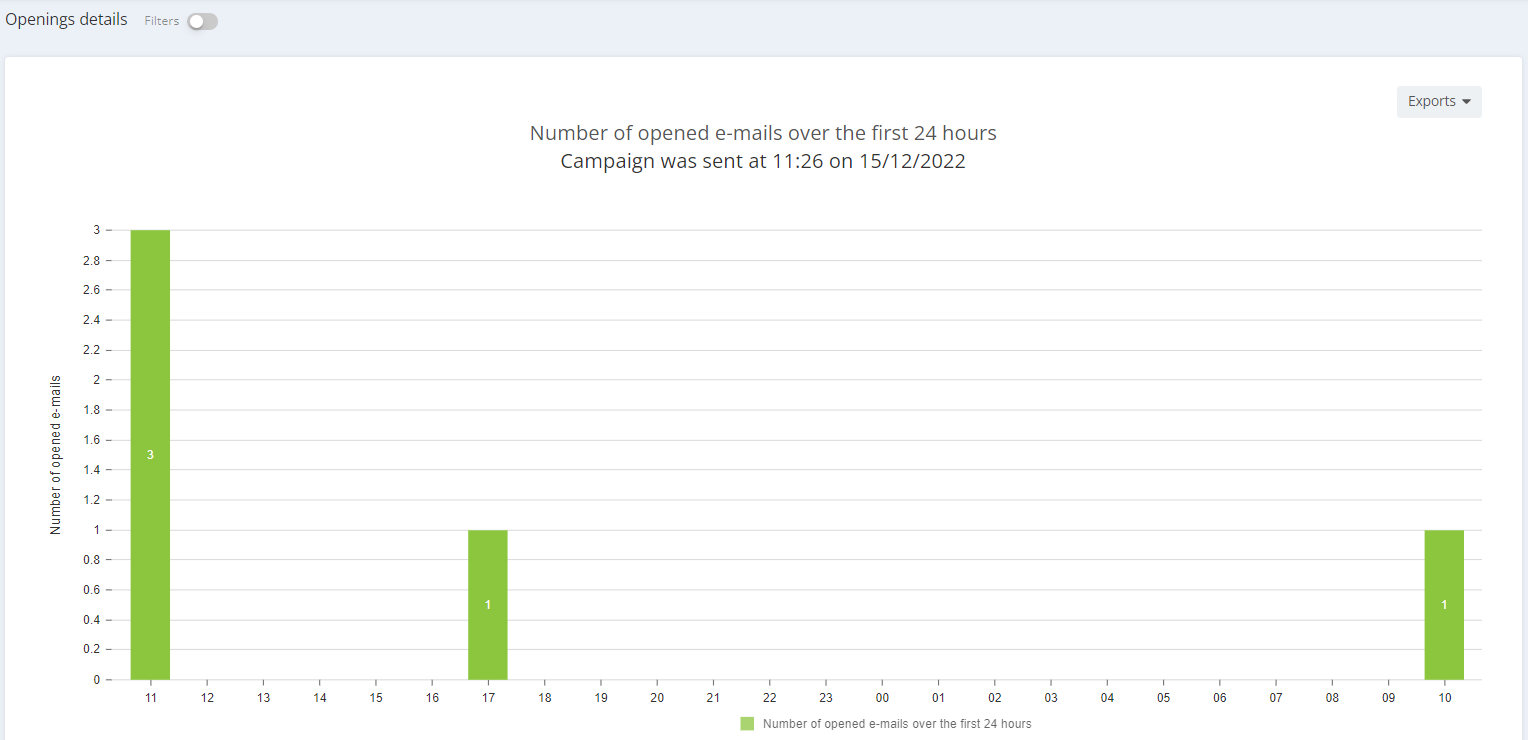
In the lower part of the screen you can view a graph representing the number of emails opened by hour during the first 24 hours. Again, if you switch on the filter, you can view the results of the profiles depending on their segment, language or gender.
The following two charts are a comparison chart between the number of opened emails and the cumulated number of emails, both figures during the first 10 days...
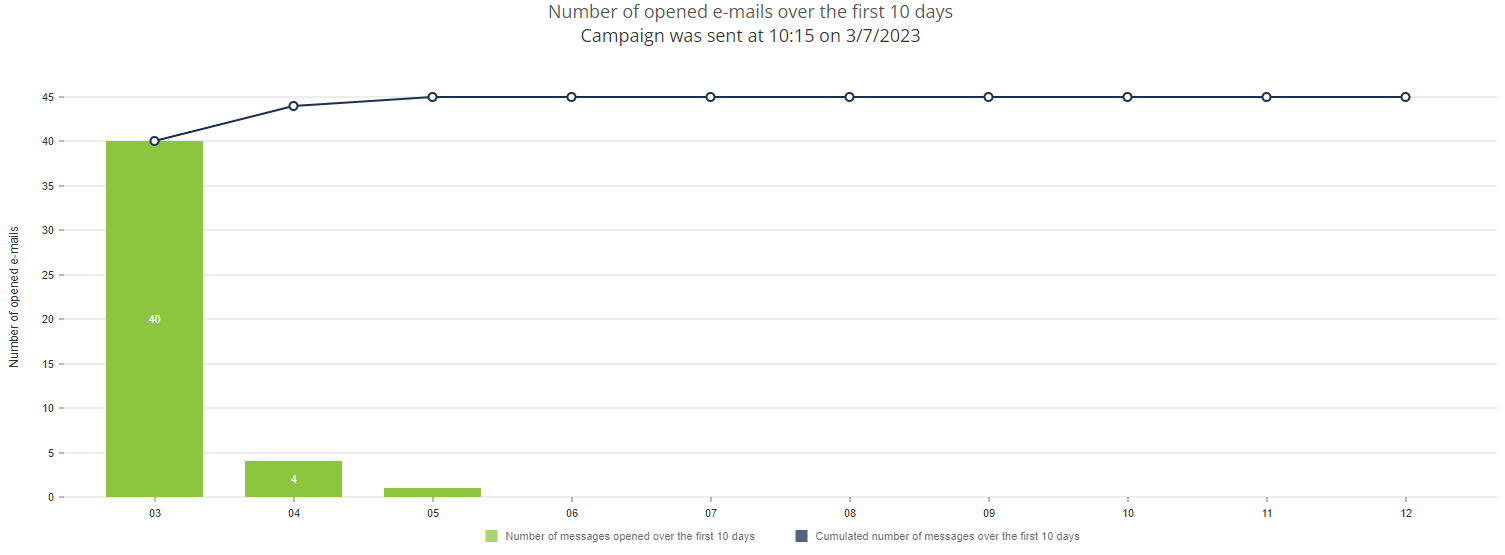
and a comparison table with the number of opened emails by device. It is important to remember that openings are not unique in this table. That means that, if a profile opens an email twice, once from their computer and once from their phone, it will be counted as two openings.
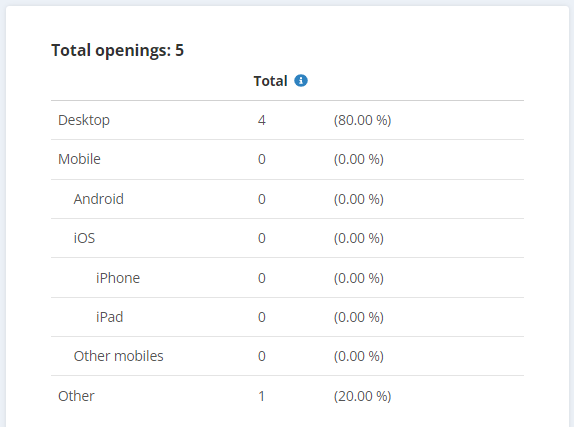
The different devices are the following:
- Dekstop = a dekstop computer
- Mobile
- Android = a mobile having Android as operating system
- iOS = a mobile having iOS as operating system
- iPhone
- iPad
- Other mobiles = a mobile having another operating system
- Other = when the opening has been recorded through a proxy (such as Gmail or Yahoo)
Automated openings made by security screening bots or by Apple iOS 15 Mail Privacy Protection feature are filtered. See more details 'here'.
4. Clicks tab
In this tab, you will find information on your click rates.
Only the links for which you enabled tracking when creating the email will appear in the report.
In the first table you can see the number of messages clicked at least once and compare it to the percentage of delivered, sent and open emails, and the percentage of population targeted.
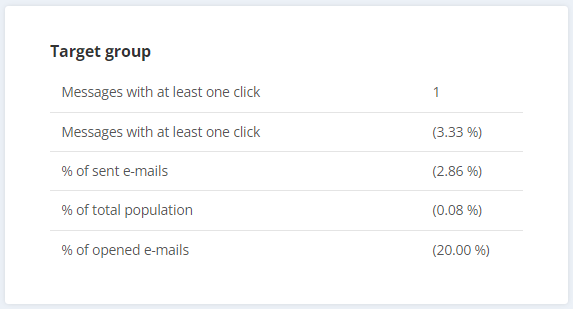
Clicks are only counted the first time that the user clicks on it. For example, if a user clicks on one link 3 times, the link will only be counted once.
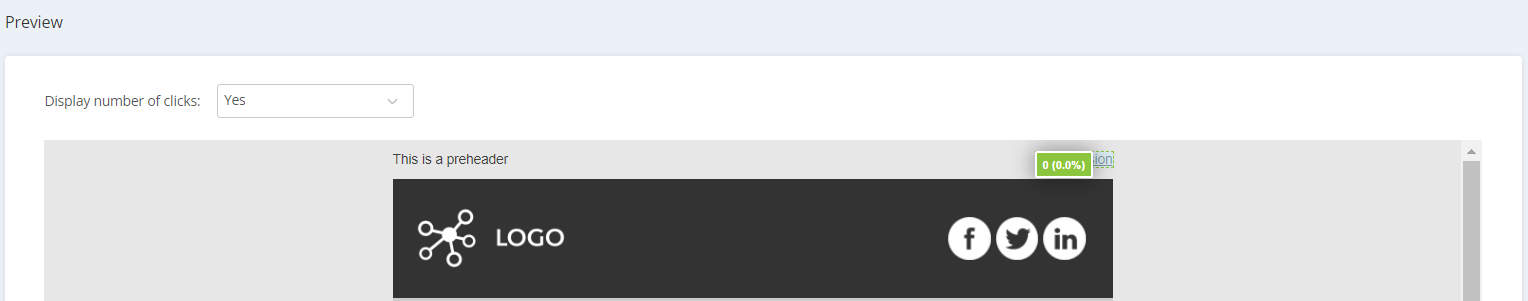
If you switch on the click counter, you will see a preview of your message in which the clicking areas of the message will be marked. You will also see the number of unique clicks (one per profile) in each area, as well as the performance your Call to Action buttons.
The following chart is a graph with information on the links with a greater performance.
The last table of the section gives information about the 'technical' links, namely the unsubscribe and the web version links. If a profile only clicks on one of those links, the e-mail does not count as 'clicked', because they do not represent useful engagement (the profile did not go to your website).
On the other hand, clicks recorded while being on the webversion mirror page are counted as usual.
5. Deliverability tab
In this tab, you will find information on your deliverability rates.
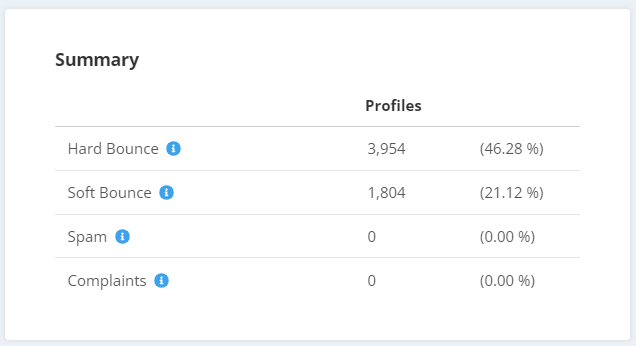
You will first find a table with information on:
- Hard bounces = the number of hard bounces
- Domain name unknown (after the @)
- Username unknown (before the @)
- Other type of hard bounce
- Soft bounces = the number of soft bounces
- Mailbox of the recipient is full
- Other type of softbounce (e.g. expired message because blocked on the reception domain)
- Spam = the number of emails that the Webmail provider considered spam
- Complaints = number of emails that were reported as spam by a profile
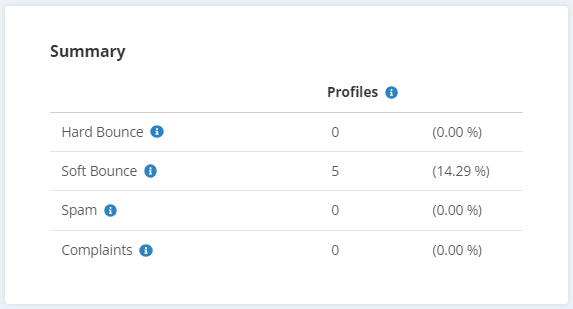
Hard bounces happen when the recipient's email address doesn't exist anymore, and soft bounces take place when there is a temporary problem, such as the recipient's inbox being completely full. Those messages considered spam by webmail providers don't even reach the recipient's spam folder.
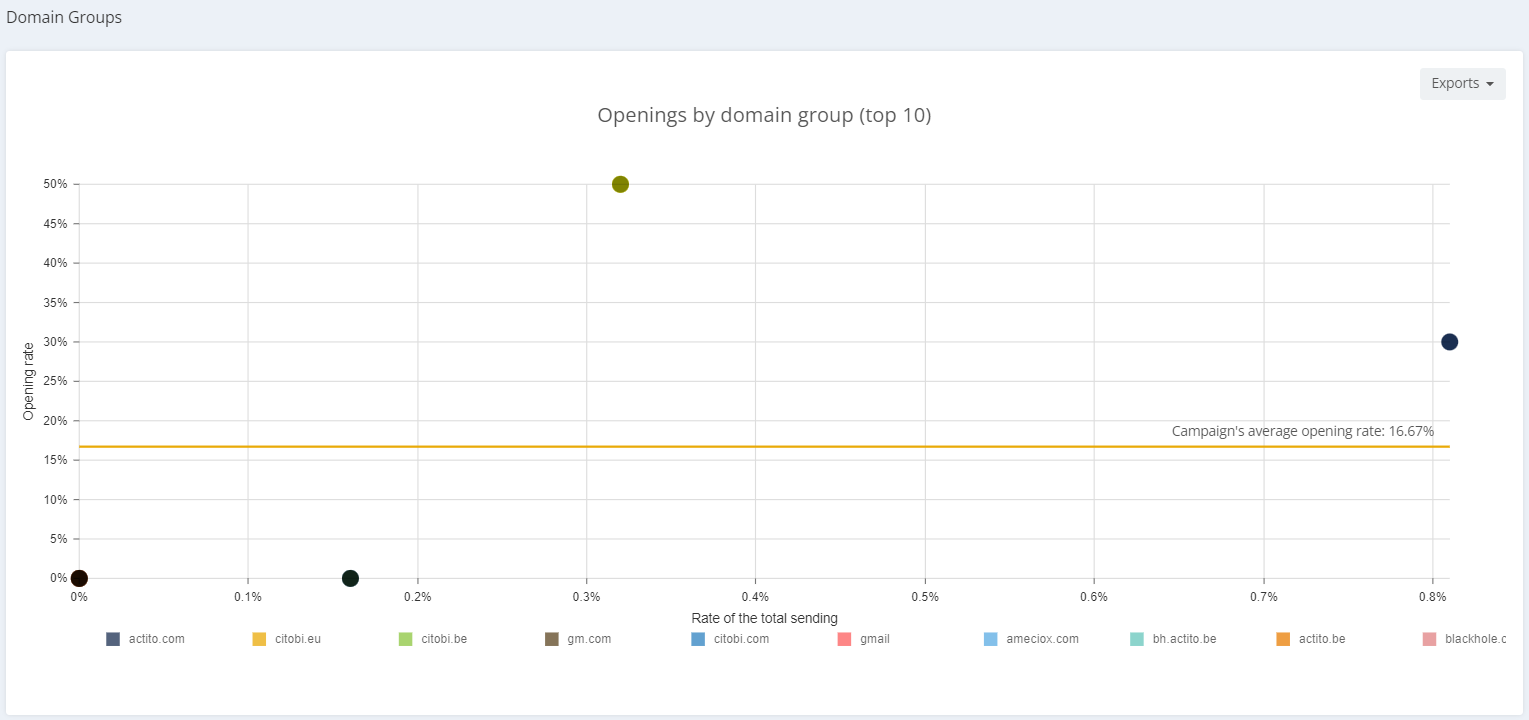
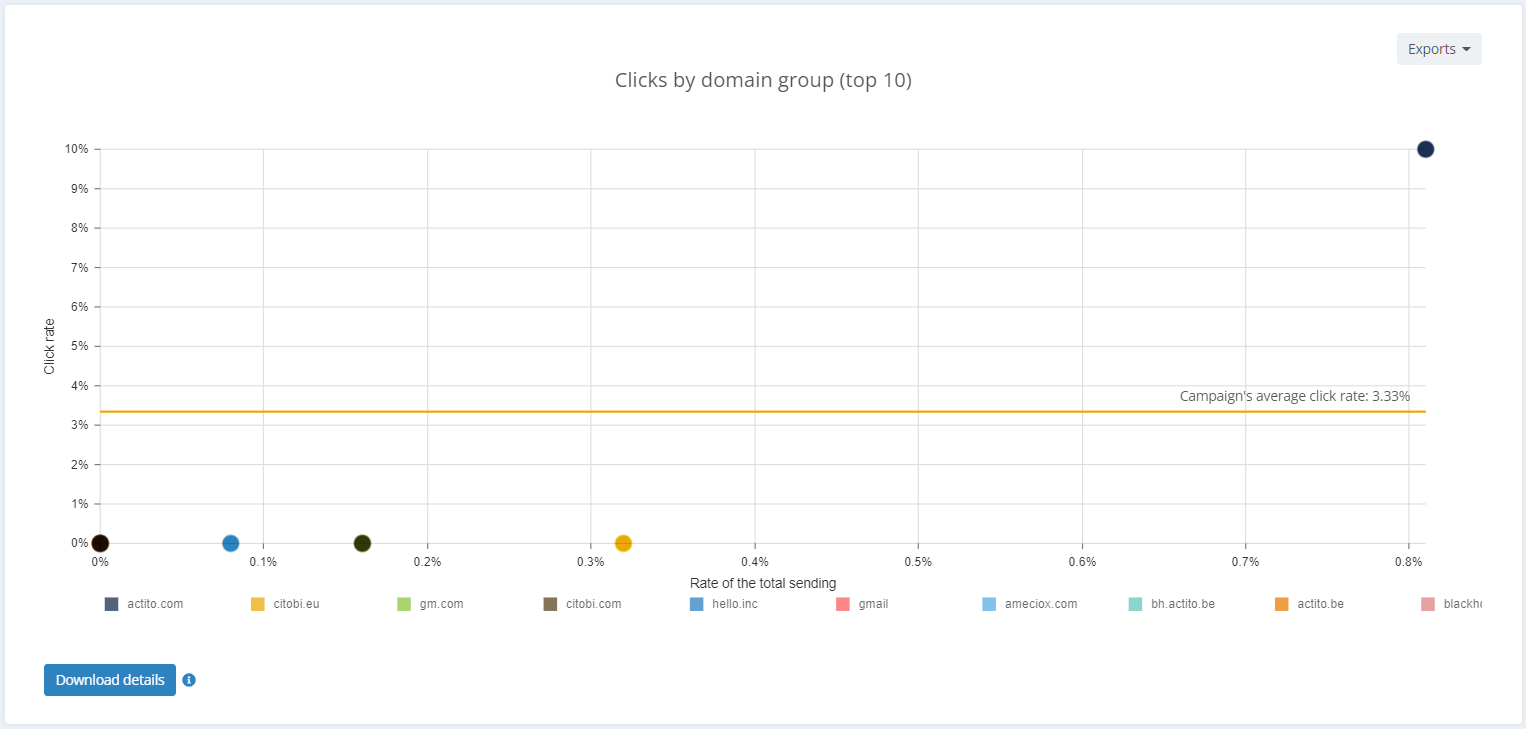
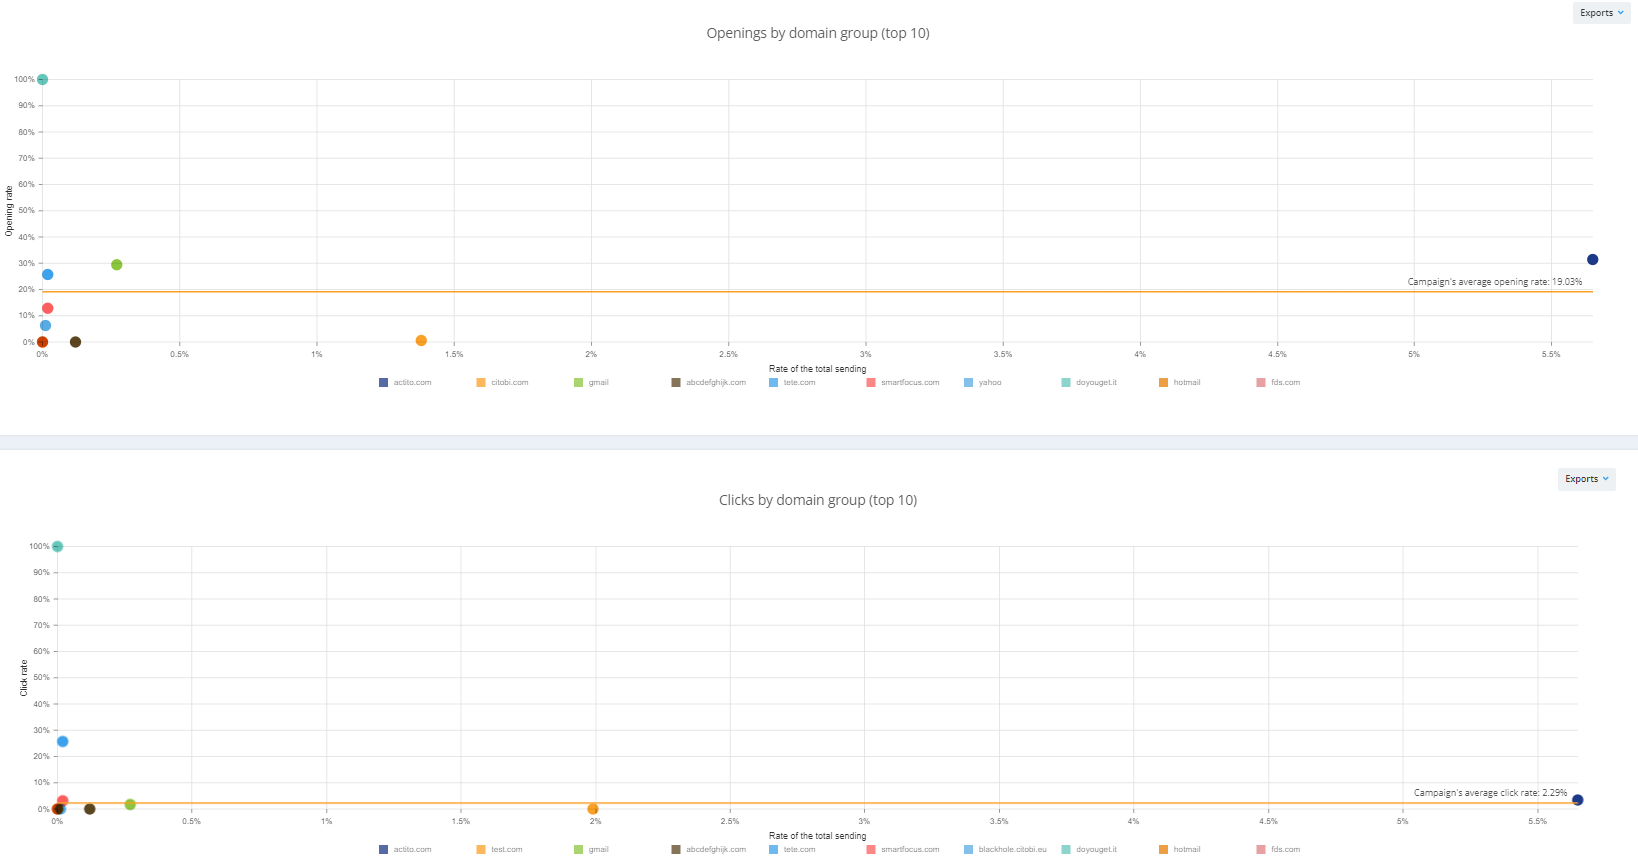
The following two tables allow you to compare the opening and click rates by domain. This information will help you realise if a given webmail provider presents suspicious behaviour so that you can easily identify deliverability issues such as a low reputation, the webmail considering your emails spam, etc.
Understanding e-mail campaign reports according to subscription or sending domain
If you filter your campaign reports by subscription or sending domain, you can view the report for one subscription/sending domain, or compare reports for several subscriptions/sending domains.
1. Summary tab
The Summary tab will be your welcome interface to the reporting app. At the right side of the screen, you will see a graph representing your rates of sent, delivered, opened and clicked emails for all campaigns linked to the subscription/sending domain.
Whenever you see the 'Exports' button, you can print or download the graph.
At the left side of the screen, you will see a series of tables:
- Table of data on the target group
You will observe different statuses in this table:
- Targeted profiles = number of profiles in the target for all campaigns
- In error = number of profiles for which the email could not be sent due to an error
- Error when routing the email
- Error when generating an email (e.g. with its personalization, with the rendering of the HTML...)
- Error in one of the parameters of the email
- The target profile is not part of the profile table linked to the email campaign
- The target profile is not part of the targeting of the mailing
- Error of a personalization value
- Limit of non-filtered profiles is reached (for transactional emails)
- Definition of the target of the email campaign is invalid
- Filtered = number of profiles filtered by the Smart filter
- The target profile has no email address
- The profile email address is known, but syntactically invalid
- A duplicate email address
- A complaint has been recorded by a profile
- The domain name of the email address is part of a list of service domain names updated by Actito's deliverability team
- The commercial pressure was activated for this profile
- The email address is temporary quarantined due to encountering bounces. This quarantine is temporary because Actito thinks it is still possible to contact this email address.
- The email address is quarantined permanently due to encountering hard bounces. Actito considers it is not possible to contact this email address anymore and will not try again.
- The email exceeds the maximum size of 4MB set up in order to optimize the inbox loading time
- The profile was randomly filtered in the control group of the campaign
- Net (sent) = number of profiles who did receive the email
This table compares the numbers of these four categories. Each profile is counted only once (unique number).
2. Table of data on the campaign results
Here again, you will observe different statuses:
- Sent = number of emails that are sent
- Bounced = number of emails that have bounced
- Delivered = number of emails that have been delivered
- Opened/(Delivered) = number of emails that were opened out of the number delivered
Openings are recorded when the images are downloaded, thanks to a tracking pixel, or when a click is recorded (see specificities for Apple iOS 15)
Only the first opening is recorded.
- Clicked/(Opened) = number of emails that were clicked out of the number opened
- Clicked/(Delivered) = number of emails that were clicked out of the number delivered
Clicks are recorded thanks to the redirection through your branded link domain.
Only the first click is recorded.
- Unsubscribed/(Delivered) = number of emails that were unsubscribed out of the number delivered
- Complaints/(Delivered) = number of emails that were marked as spam out of the number delivered
As in the previous table, profiles are counted only once.
If a profile only clicks on the Webversion or Unsubscribe link, the e-mail does not count as 'clicked'.
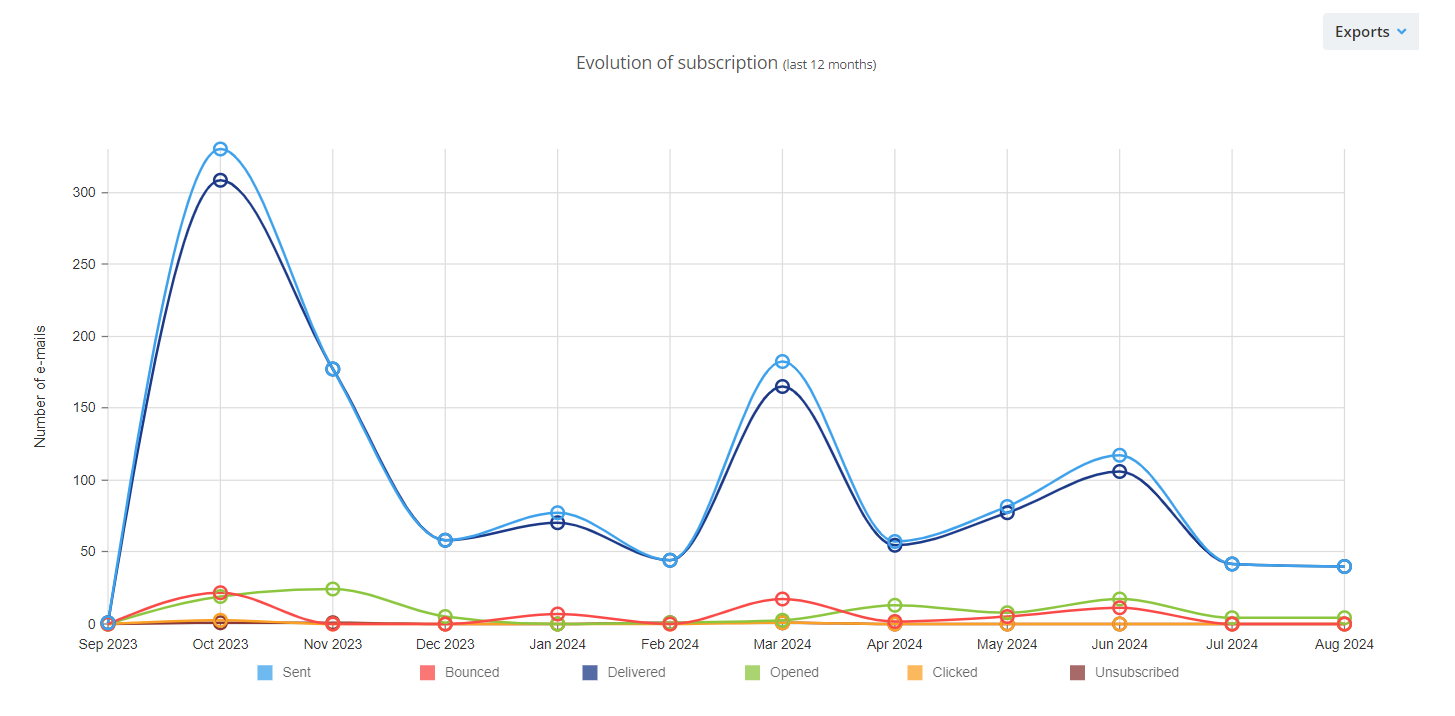
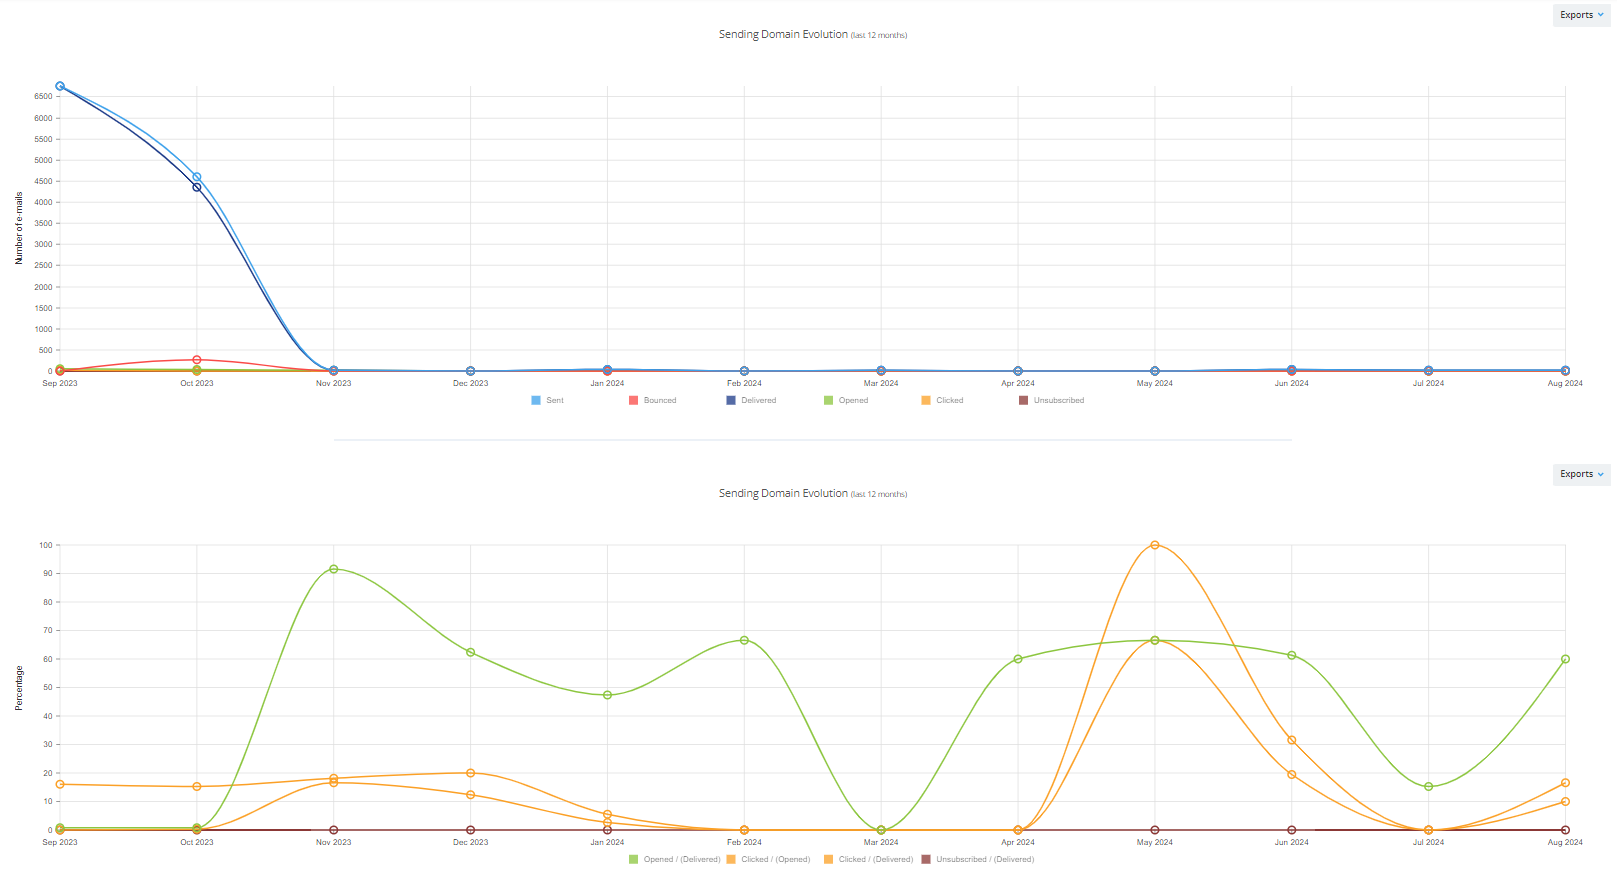
In the lower part of the deliverability tab, you will also find two graphs.
The first graph shows the evolution of subscriptions/sending domain over the last 12 months.
The second graph shows this evolution in ratio to the number of e-mails delivered or opened.
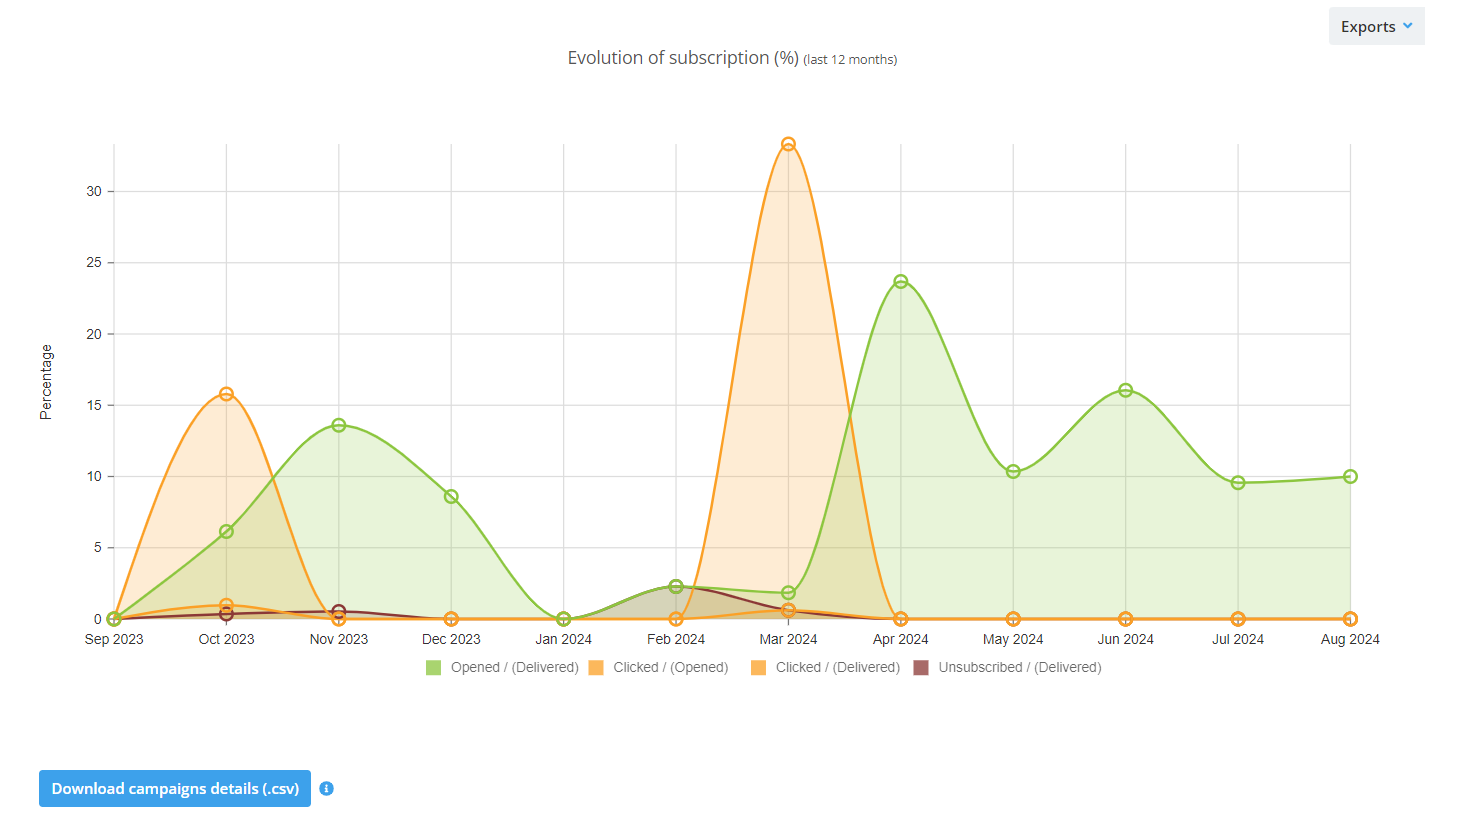
These graphs give you details of e-mails sent, delivered, opened, clicked, bounced and unsubscribed over the last 12 months.
You will always have these data for the last 12 months, no matter which date filter you set.
Using filters
It is also possible to obtain more precise results thanks to filters. These are available in the summary and comparison/deliverability tabs. For example, you can view the results of the profiles depending on the segment they belong to, the language they speak or their gender. For that, switch on the filter in the upper part of the screen and choose your wished action.

2. Comparison/Deliverability tab
Comparison tab – Subscription
In this tab you will find deliverability information of the latest campaigns linked to the chosen subscription.
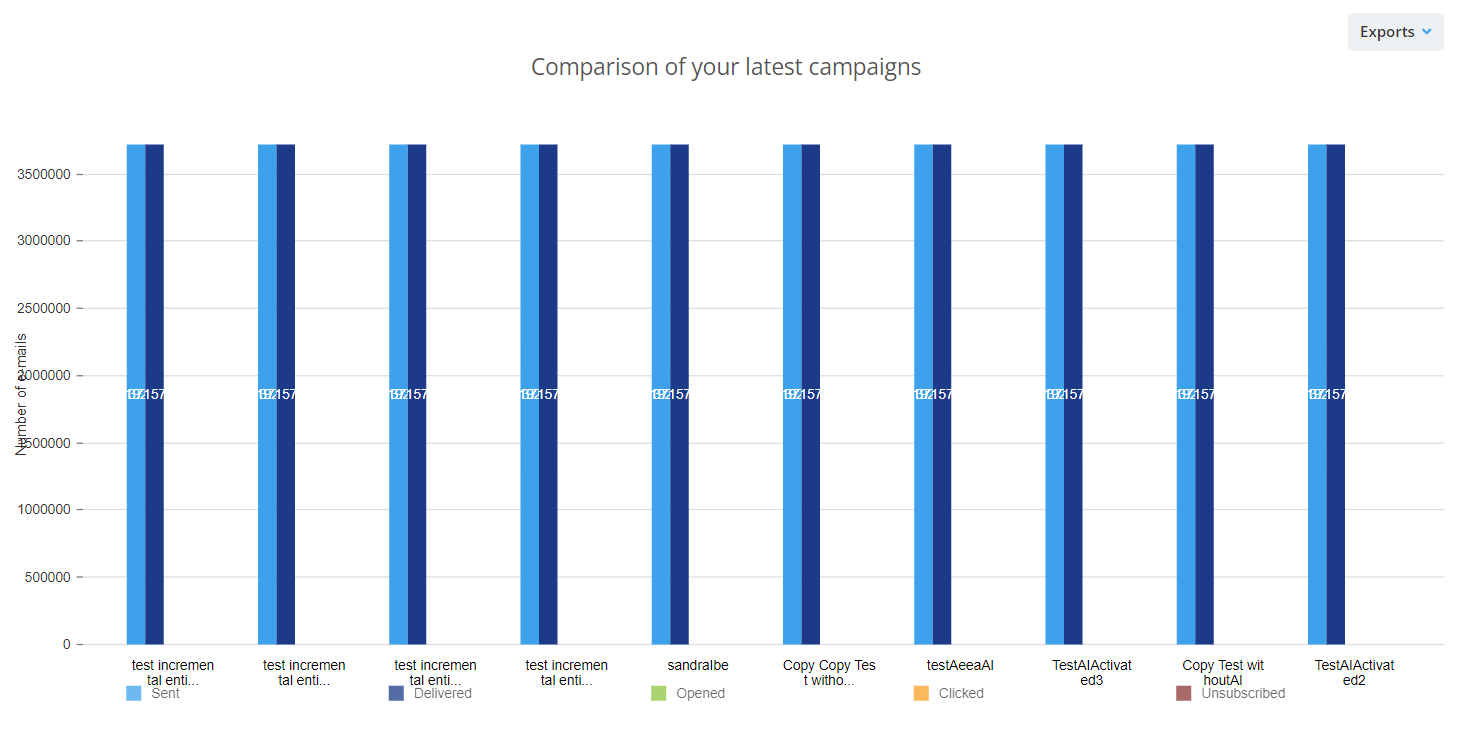
In the first graph, you can see the number of e-mails sent, delivered, opened, clicked and unsubscribed for the last 10 campaigns. This allows you to compare the impact your latest campaigns have had on your profiles.
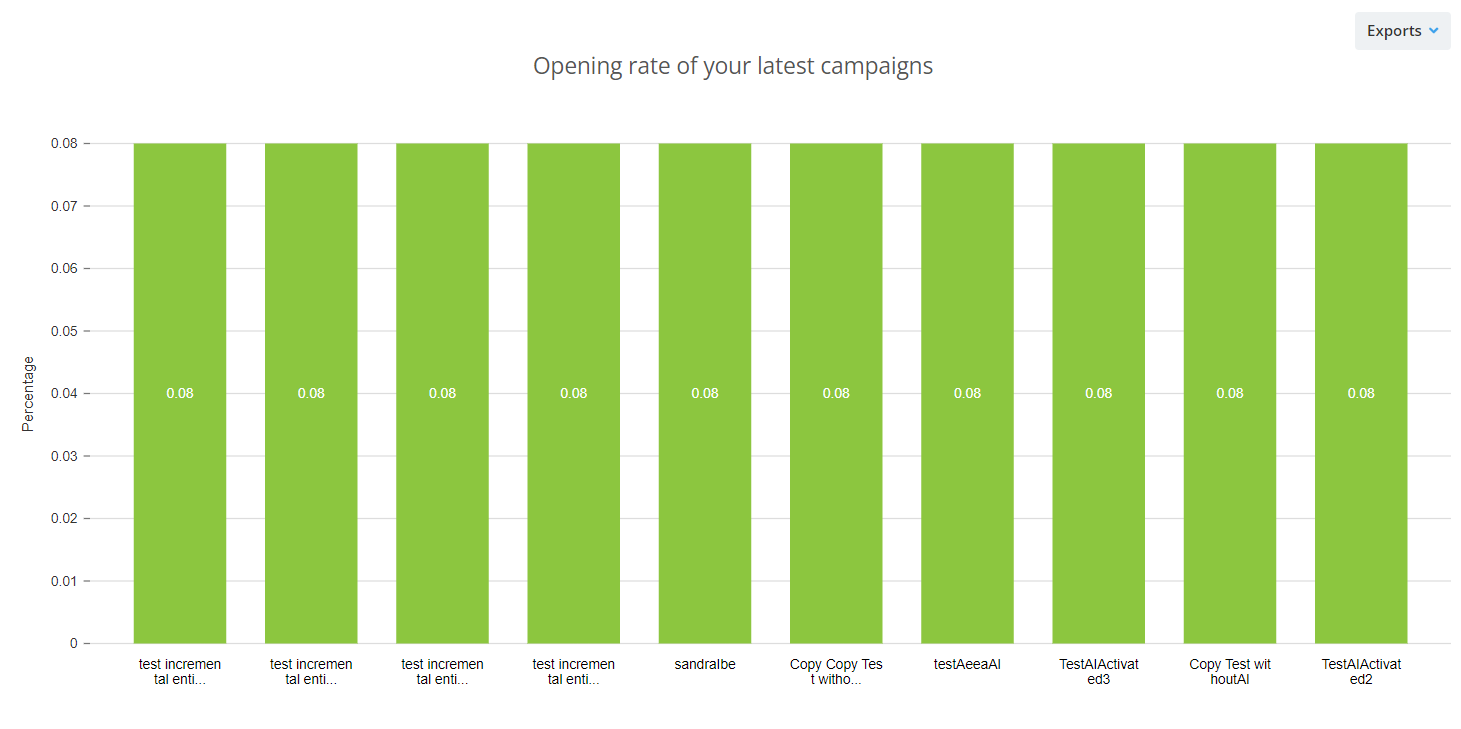
The following graph gives you the opening rate of your most recent campaigns.
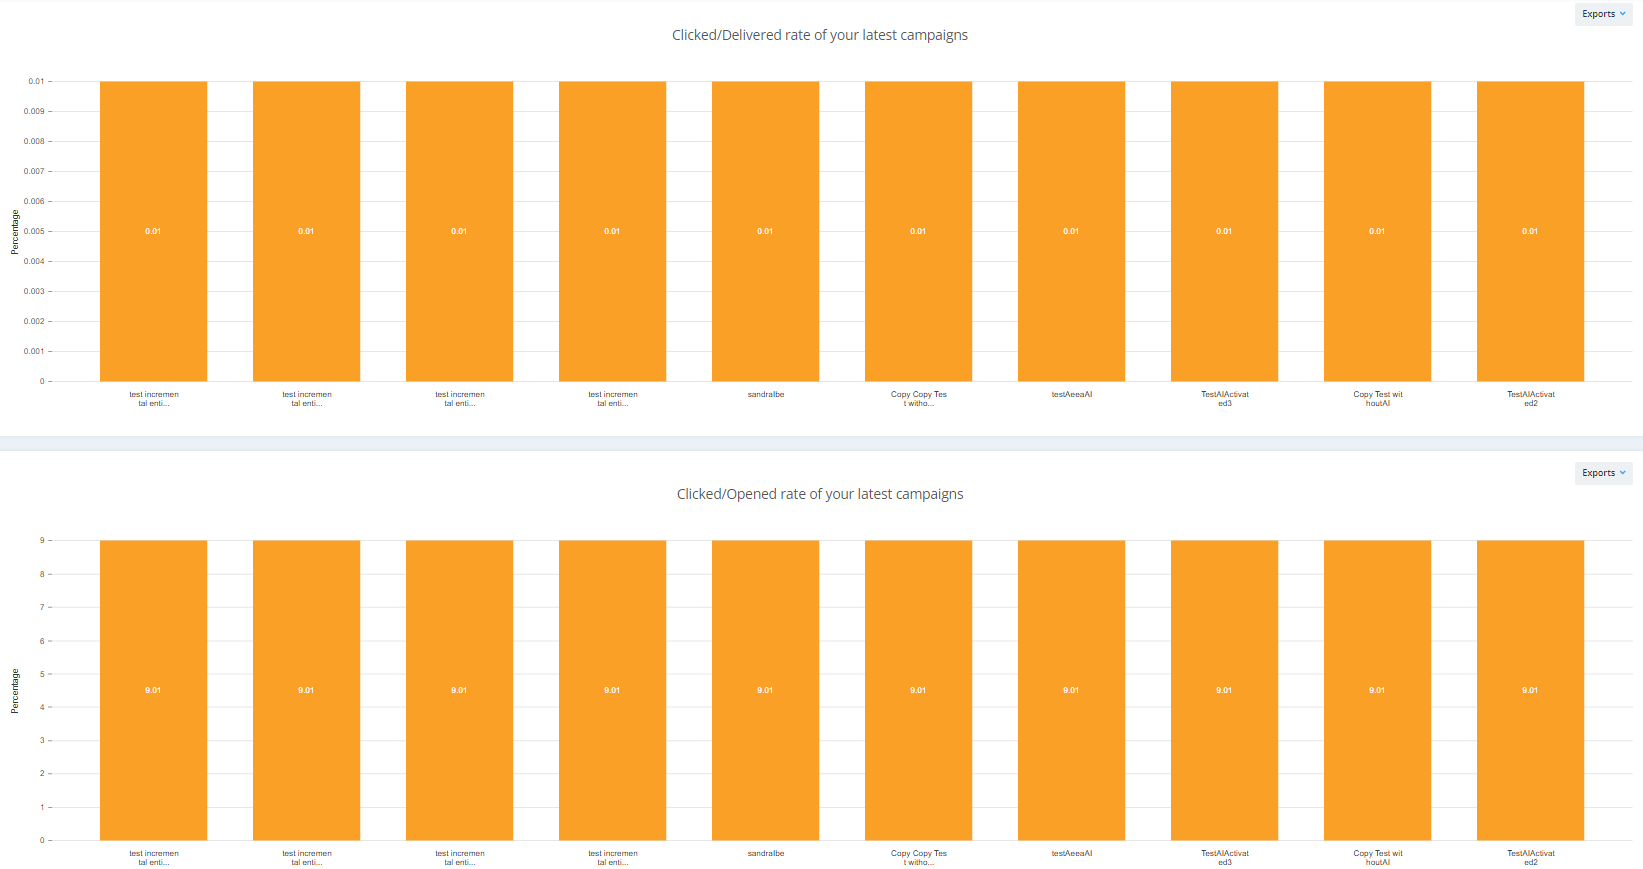
Finally, the last two graphs allow you to compare click rates (as a percentage) by number of e-mails delivered and opened for your latest campaigns. This gives you the opportunity see which campaigns generated the most interaction.
Deliverability tab – Sending domain
In this tab, you will find information on your deliverability rates.
You will first find a table with information on:
-
Hard bounces = the number of hard bounces
- Domain name unknown (after the @)
- Username unknown (before the @)
- Other type of hard bounce
-
Soft bounces = the number of soft bounces
- Mailbox of the recipient is full
- Other type of softbounce (e.g. expired message because blocked on the reception domain)
-
Spam = the number of emails that the Webmail provider considered spam
-
Complaints = number of emails that were reported as spam by a profile
Hard bounces happen when the recipient's email address doesn't exist anymore, and soft bounces take place when there is a temporary problem, such as the recipient's inbox being completely full. Those messages considered spam by webmail providers don't even reach the recipient's spam folder.
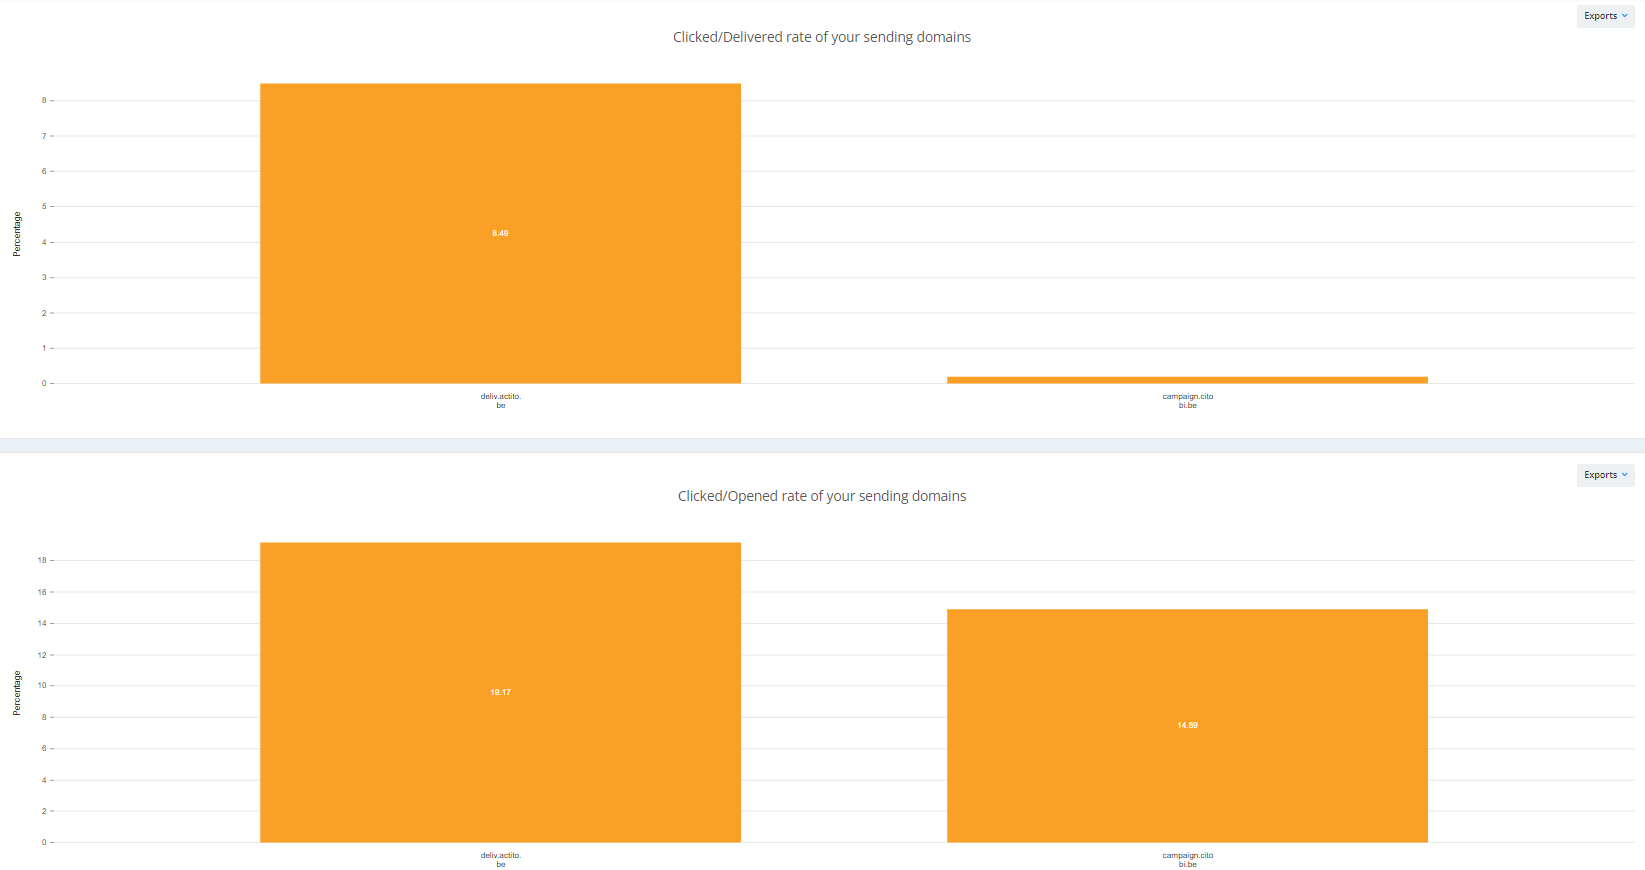
The following two tables allow you to compare the opening and click rates by domain. This information will help you realize if a given webmail provider presents suspicious behavior so that you can easily identify deliverability issues such as a low reputation, the webmail considering your emails spam, etc.
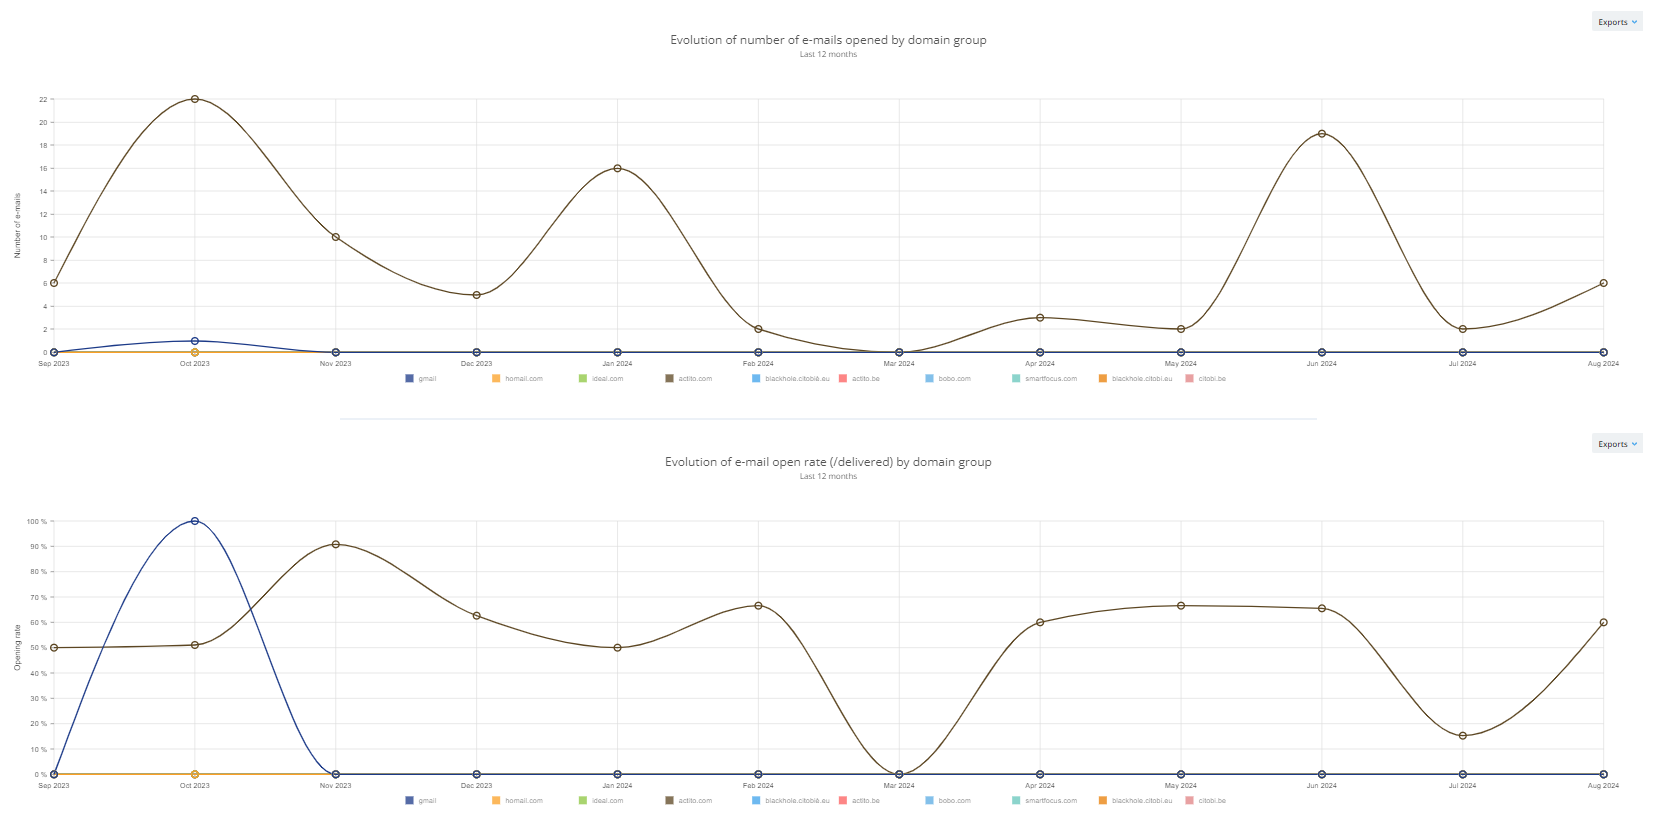
You will also find two graphs showing the evolution of the number of e-mails opened and the open rate by domain group over the last twelve months.
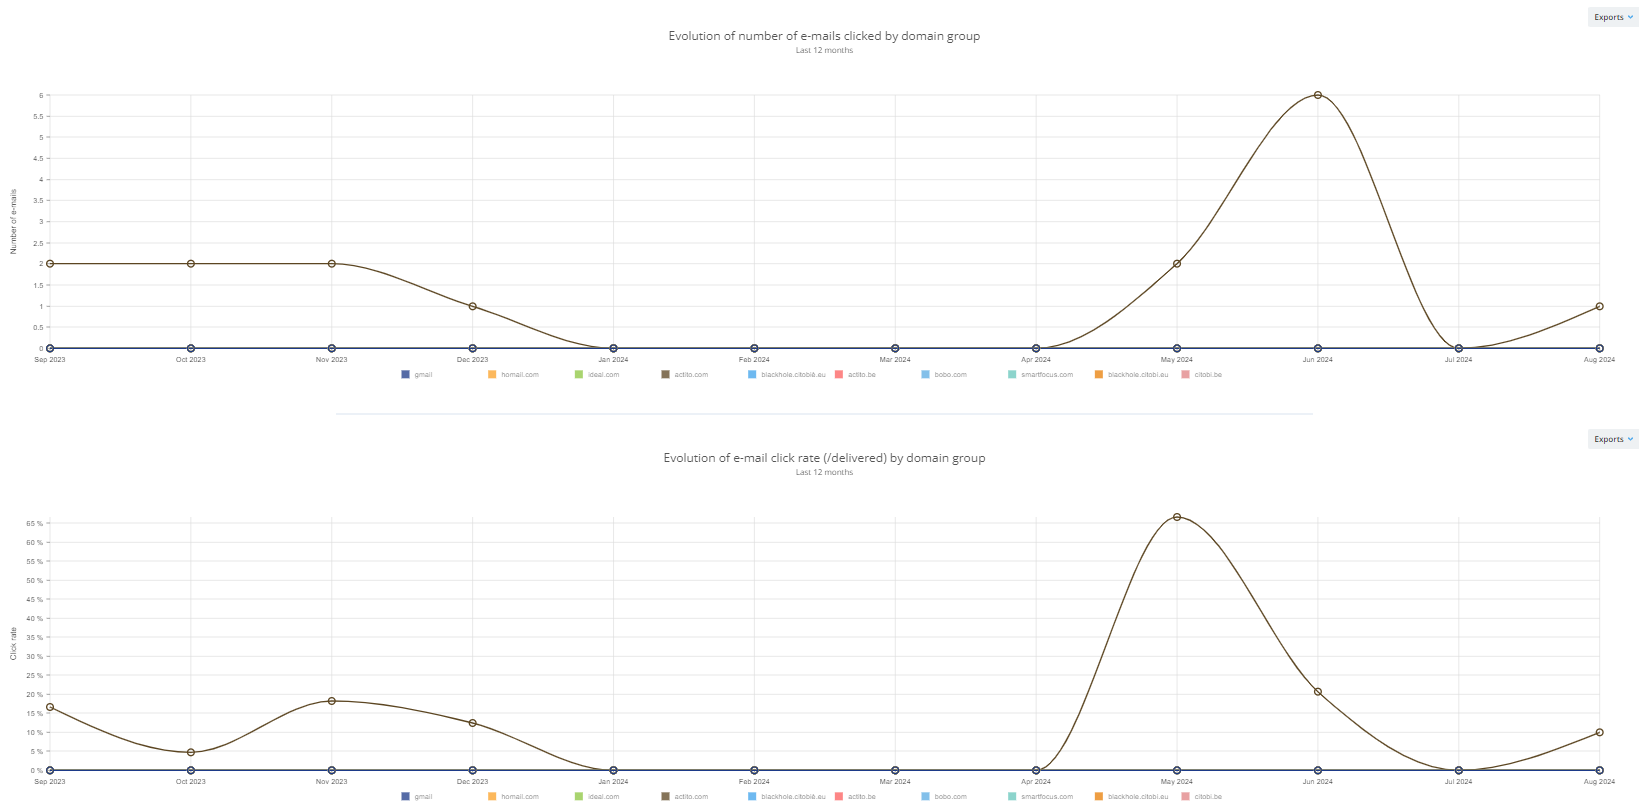
Finally, you will find two graphs showing the evolution of the number of e-mails clicked and the click rate by domain group.
Understanding the comparison report between several campaigns, subscriptions or sending domains
Comparing the reports of several campaigns/subscriptions/sending domains will return an aggregated report presenting data for all the campaigns included in the comparison.
The information is organized in two different tabs. You can navigate between these tabs in the left-hand menu.
1. Summary tab
The Summary tab will be your welcome interface to the reporting app. At the right side of the screen, you will see a graph representing your rates of sent, delivered, opened and clicked emails for all the campaigns/subscriptions/sending domain compared.
On the left you will see two tables, showing the target population and campaign results data for all compared campaigns or campaigns linked to the compared sending domain/subscription.
On the lower part of your screen, you will also find two graphs showing the evolution of campaigns/subscriptions/sending domains over the last twelve months.
These graphs allow you to see when your campaigns have generated the most interactions from your profiles, and how these interactions have evolved over time.
Graph results are presented over the last 12 months, regardless of the date filter set.
2. Comparison tab
In this tab you will find information on the deliverability of the campaigns/sending domains/subscriptions compared.
In the first graph, you can see, for each campaign/sending domain/subscription, the number of e-mails sent, delivered, opened, clicked and unsubscribed for the time period you have defined in the date filter at the top left of your screen.
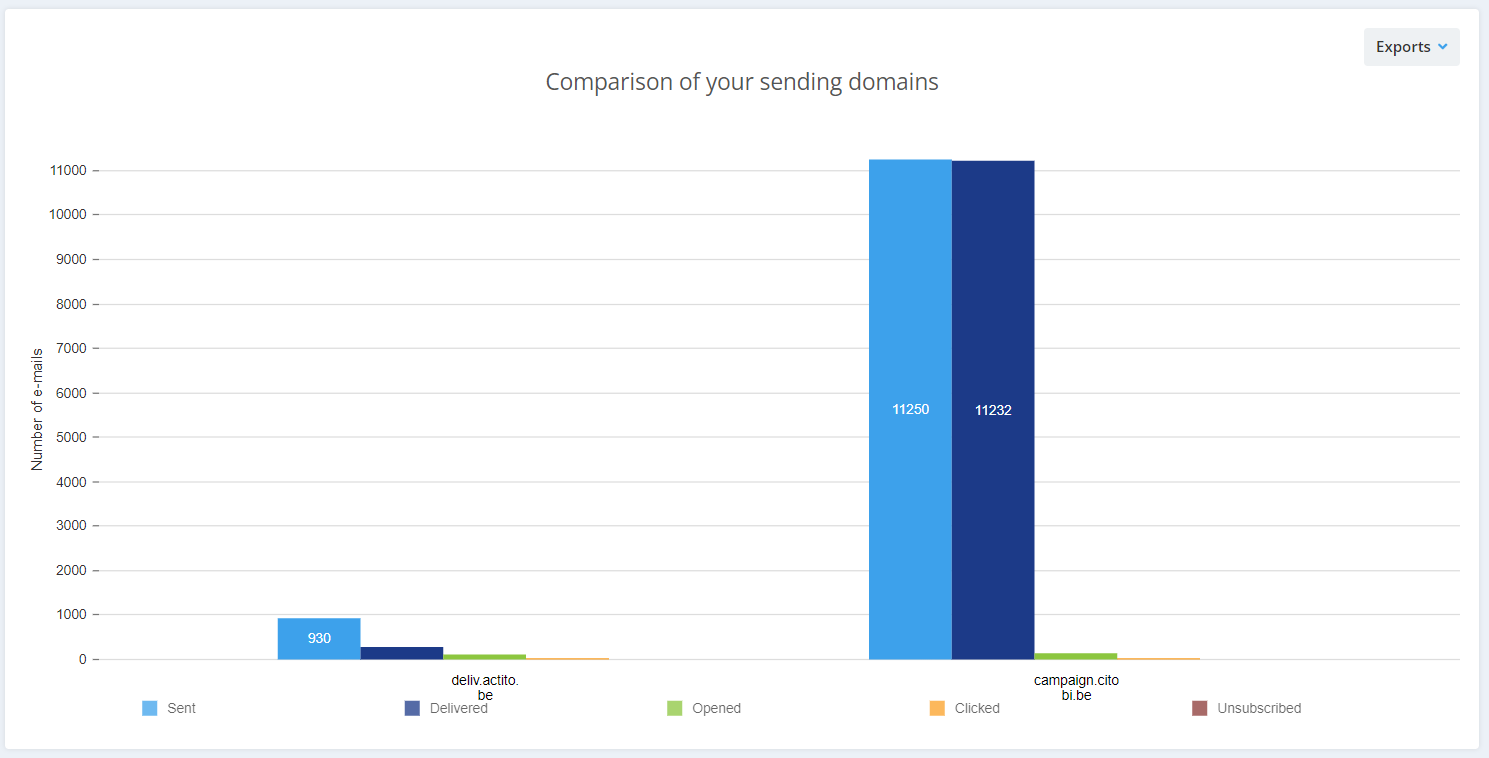
By default, this period is twelve months
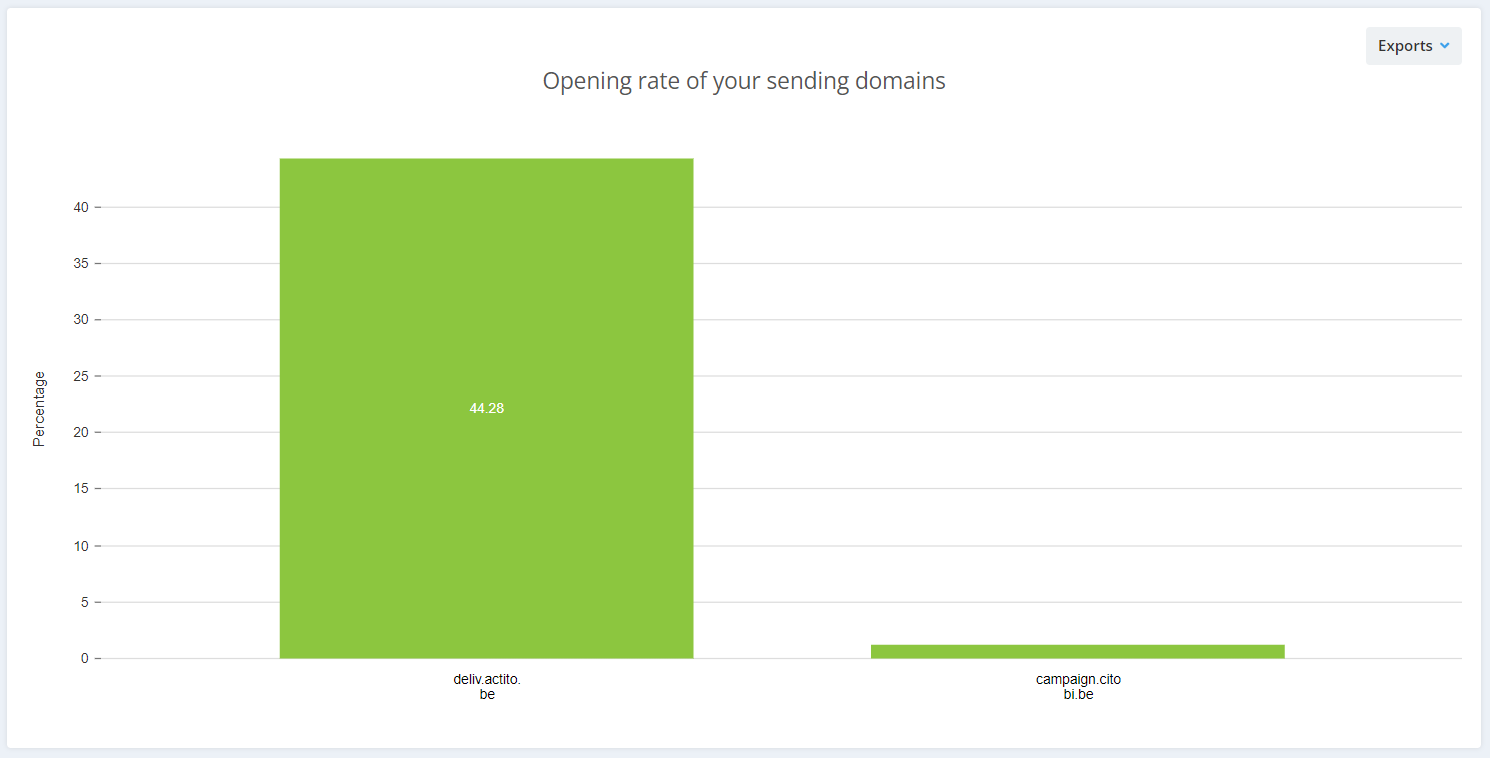
The following graph allows you to compare open rates for each campaign or for all campaigns specific to each mailing/subscription domain.
Finally, the last two graphs allow you to compare click rates by number of e-mails delivered and opened for each campaign/sending domain/subscription.
Exporting your campaign reports
You can export the results of all the campaigns included in the filtering you define, or just a selection of campaigns.
To do so, simply click on the 'Export selected' or 'Export all' button.
The export file contains only the campaigns for which KPIs have been recorded according to the chosen filtering.
The report export is a CSV file in which you will find, for each campaign :
- Campaign ID
- Sending date
- Campaign name
- Campaign sending domain
- Campaign senders
- Campaign subjects (one subject per language)
- Sending mode
- Number of profiles
- Targeted
- Unsubscribed
- Number of e-mails
- Sent
- Delivered
- Opened
- Clicked
- In error
- Filtered
- Bounced
- The ratio (in percentage) between
- Number of e-mails sent compared to the number of targeted profiles
- Number of e-mails bounced compared to the number of targeted profiles
- Number of e-mails delivered vs. number sent
- Number of e-mails opened vs. number delivered
- Number of e-mails clicked vs. number delivered
- Number of e-mails clicked vs. number of e-mails opened