Sending domain report
Sending domain reports are available in the app 'E-mail campaigns reports' (Apps > Reporting > E-mail campaigns reports). On the left side of the home page of this app, in the 'Other' category, you will see 'Sending domains':

The sending domain reports are only available in licenses having an Deliverability Subscription. The tab is greyed out in licenses who do not have that subscription. Do not hesitate to contact your account manager for more information about this subscription.
![]()
These sending domain reports will help marketeers to:
- anticipate deliverability issues by identifying declining performance. Even if emails are not blocked, marketeers can anticipate potential deliverability issues.
- detect lower engagement on specific webmail services. This allows for the identification of decreased engagement on particular webmail services.
- measure the impact of targeting changes on performance.
Viewing a sending domain report
To access a sending domain report, you will have to find the sending domain whose report you would like to view, double click it or select it and then click on 'View report'.

On the left-corner of the screen, you have to define a monthly date filter.

The Summary tab
The Summary tab shows a summary of the sending domain you selected.
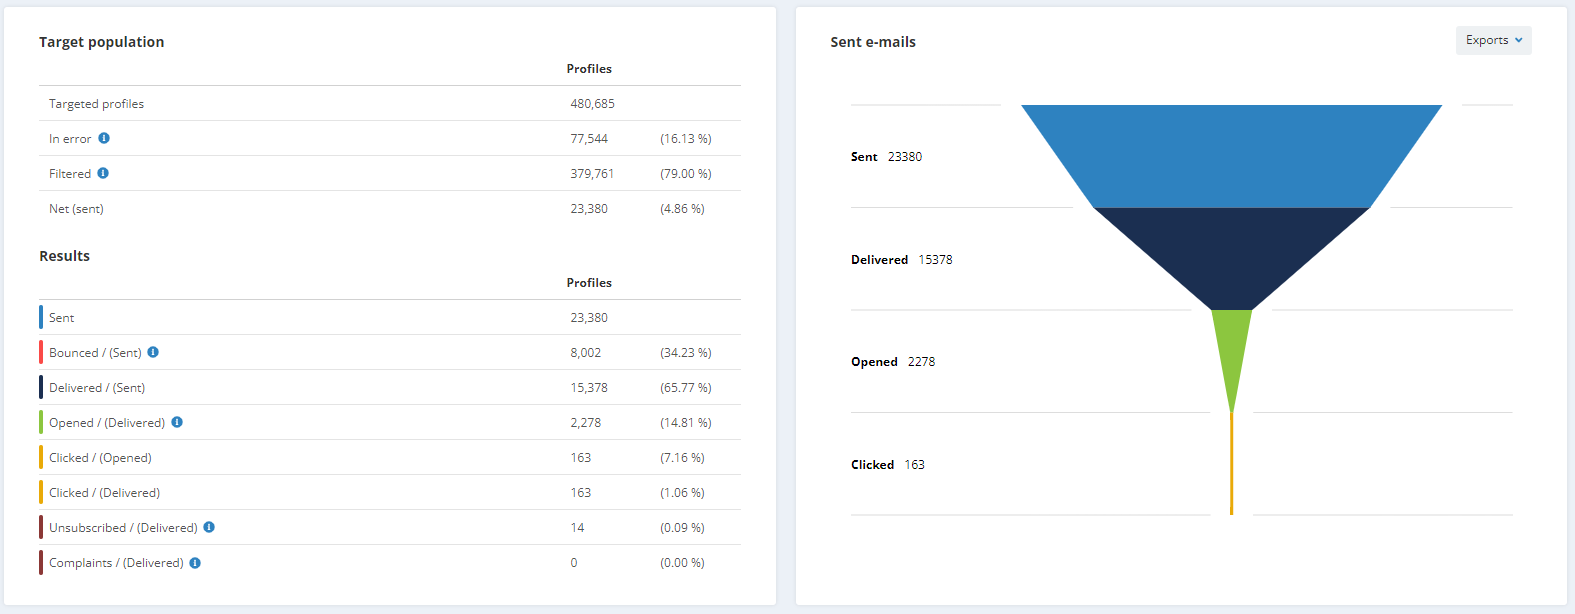
1. Target population, results, sent emails and sending domain evolution
At the right side of the screen, you will see a graph representing the rates of sent, delivered, opened and clicked emails of the chosen sending domain. You will also be able to get to know the complaint rate of the chosen sending domain.
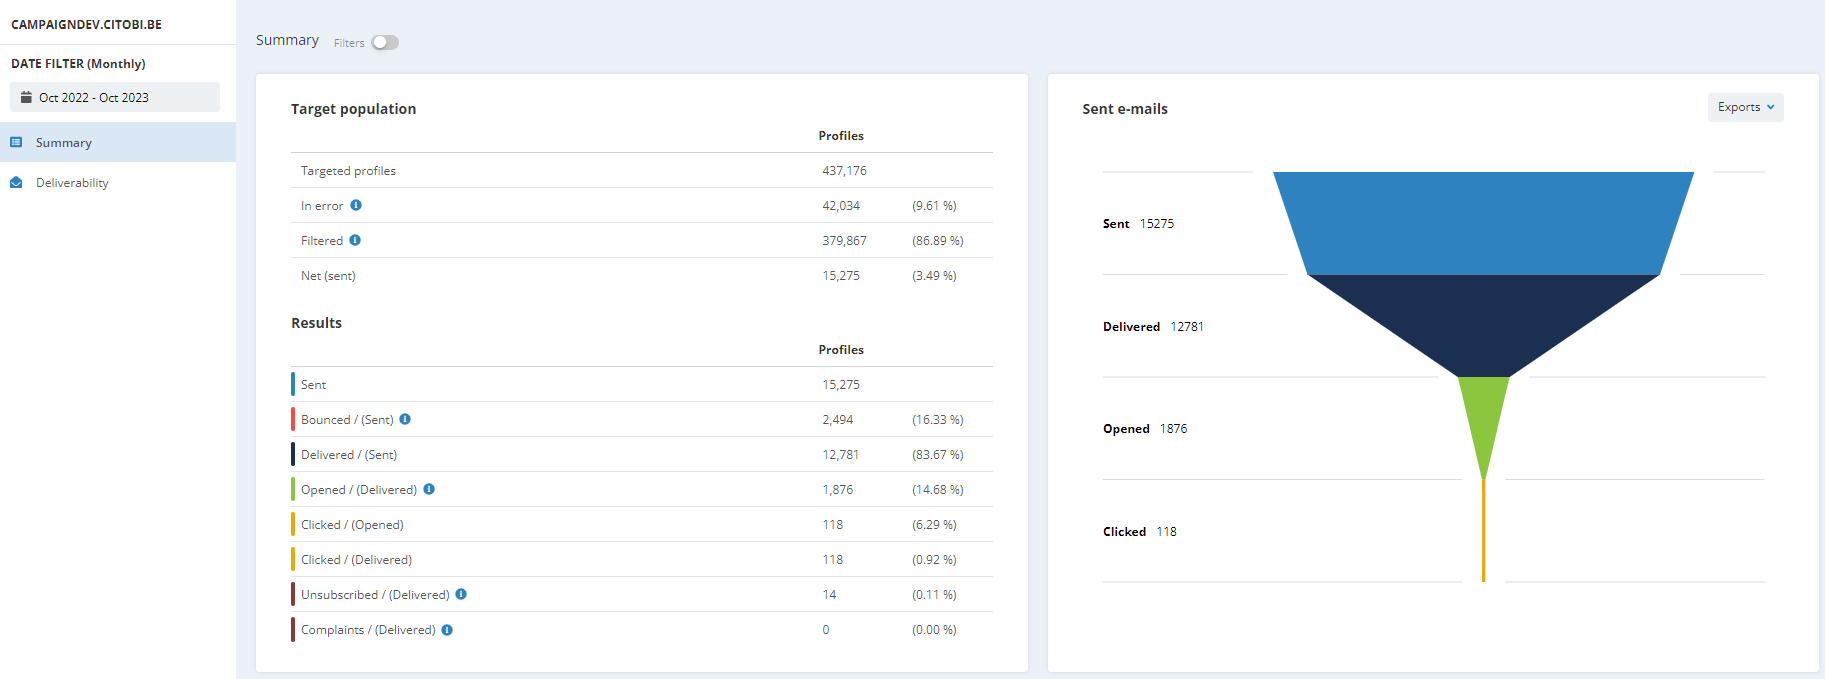
At the left side of the screen, you will see two tables:
A. Table of data on the target population of the campaigns from the sending domain

You will observe different statuses in this table:
- Targeted profiles = number of profiles in the target
- In error = number of profiles for which the email could not be sent due to an error
- Error when routing the email
- Error when generating an email (e.g. with its personalization, with the rendering of the HTML...)
- Error in one of the parameters of the email
- The target profile is not part of the profile table linked to the email campaign
- The target profile is not part of the targeting of the mailing
- Error of a personalization value
- Limit of non-filtered profiles is reached (for transactional emails)
- Definition of the target of the email campaign is invalid
- Filtered = number of profiles filtered by the Smart filter
- The target profile has no email address
- The profile email address is known, but syntactically invalid
- A duplicate email address
- A complaint has been recorded by a profile
- The domain name of the email address is part of a list of service domain names updated by Actito's deliverability team
- The commercial pressure was activated for this profile
- The email address is temporary quarantined due to encountering bounces. This quarantine is temporary because Actito thinks it is still possible to contact this email address.
- The email address is quarantined permanently due to encountering hard bounces. Actito considers it is not possible to contact this email address anymore and will not try again.
- The email exceeds the maximum size of 4MB set up in order to optimize the inbox loading time
- The profile was randomly filtered in the control group of the campaign
- Net (sent) = number of profiles who did receive the email
This table compares the numbers of these four categories. Each profile is counted only once (unique number).
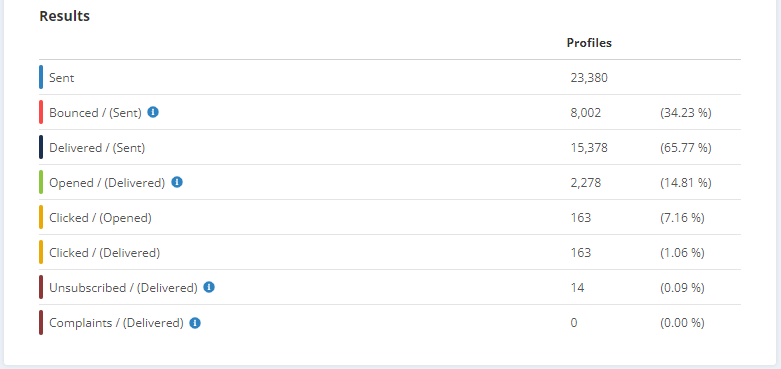
B. Table of data on the campaign results from the sending domain
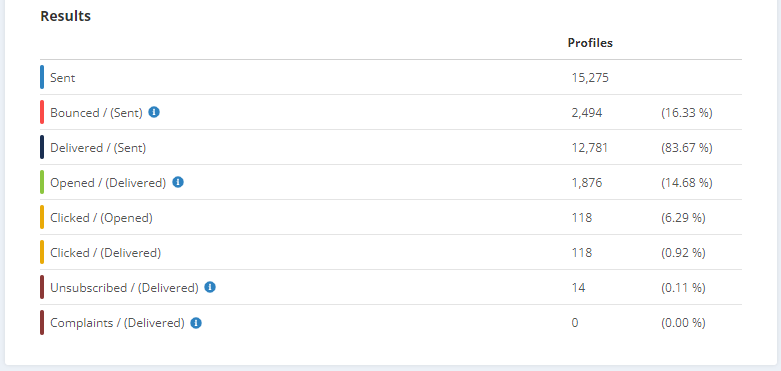
Here again, you will observe different statuses:
- Sent = number of emails that are sent
- Bounced = number of emails that have bounced
- Delivered = number of emails that have been delivered
- Opened/(Delivered) = number of emails that were opened out of the number delivered
- Clicked/(Opened) = number of emails that were clicked out of the number opened
- Clicked/(Delivered) = number of emails that were clicked out of the number delivered
- Unsubscribed/(Delivered) = number of emails that were unsubscribed out of the number delivered
- Complaints/(Delivered) = number of emails that were marked as spam out of the number delivered
As in the previous table, profiles are counted only once.
You can also view more precise results. For example, you can view the results of the profiles depending on the segment they belong to, the language they speak or their gender. For that, switch on the filter in the upper part of the screen and choose your wished action.

It should be noted that the report takes into account the segment, the language and the gender at the time the campaign was sent. It does not take into account changes made retroactively.
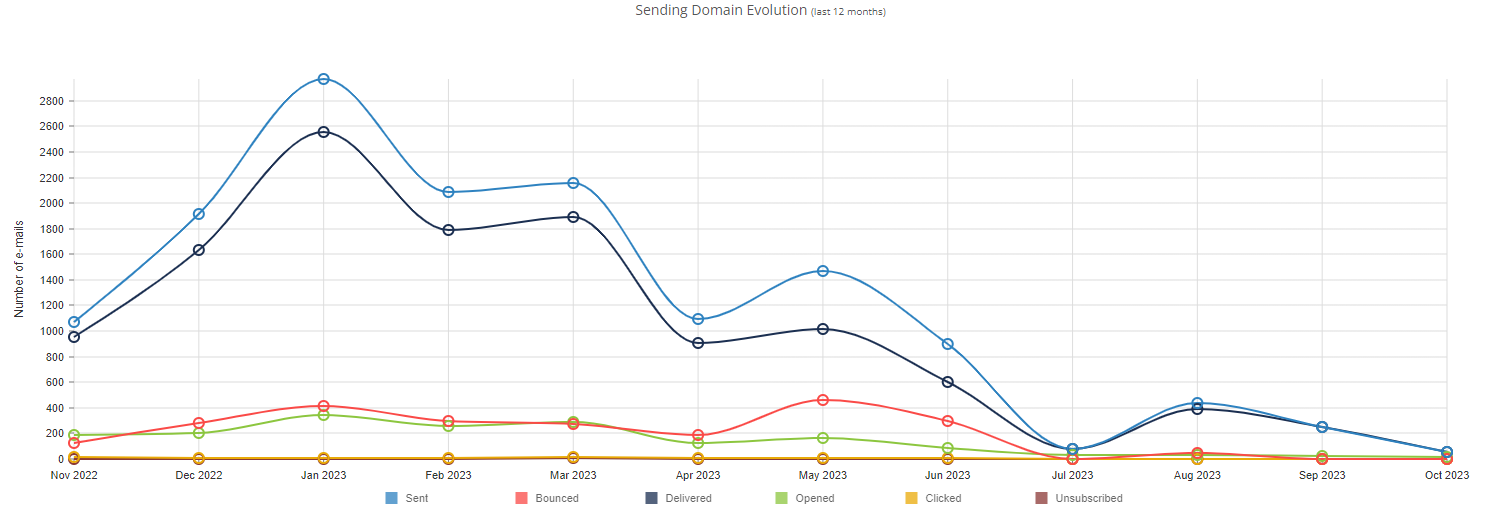
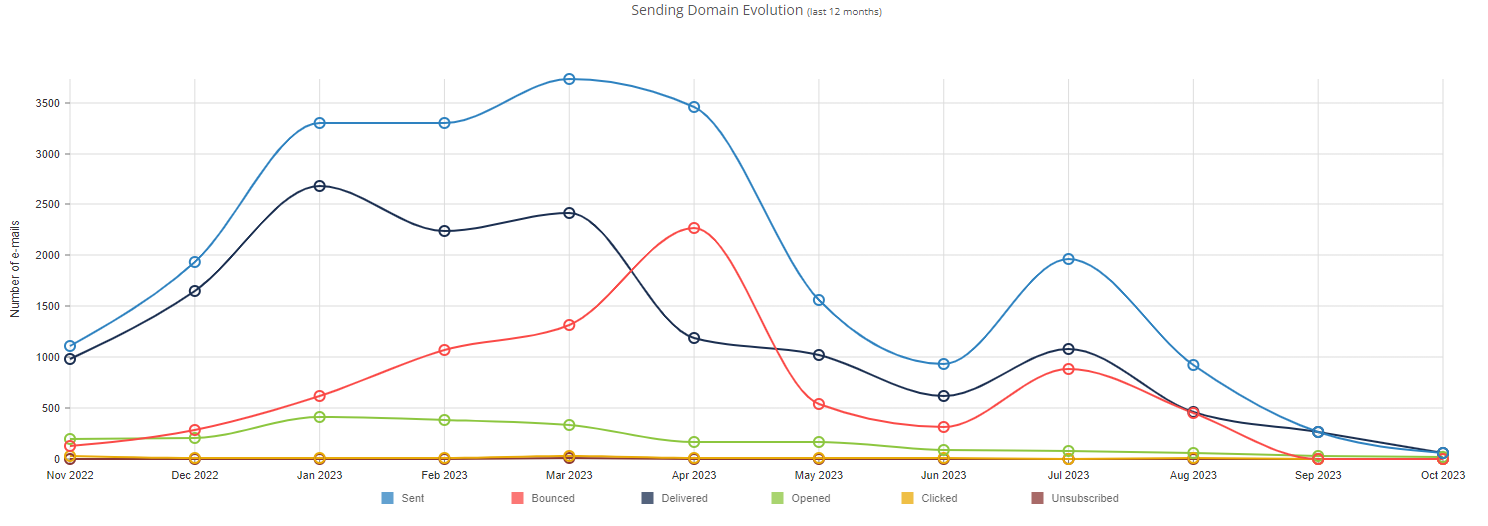
2. Sending domain evolution
Below these tables and the graph, there are two other graphs about the sending domains' evolution. These graphs are not submitted to the date filter, they take into account the last 12 months.
The first graph allows you to observe the evolution of the number of emails sent, bounced, delivered, opened, clicked and unsubscribed on a 12-month period.
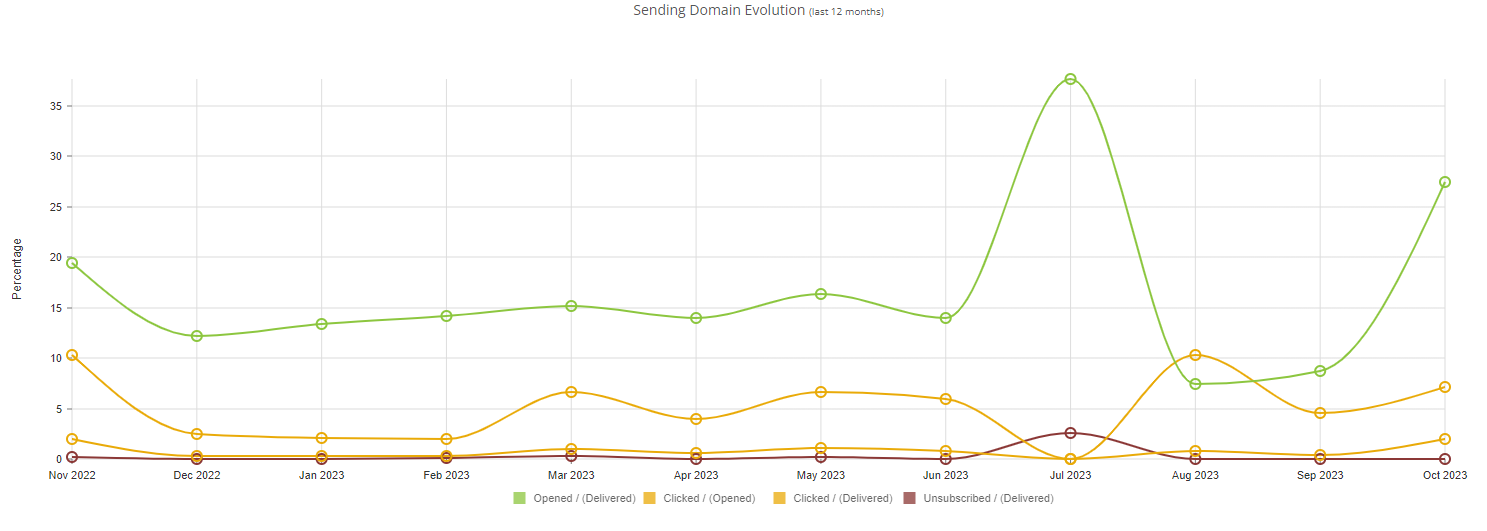
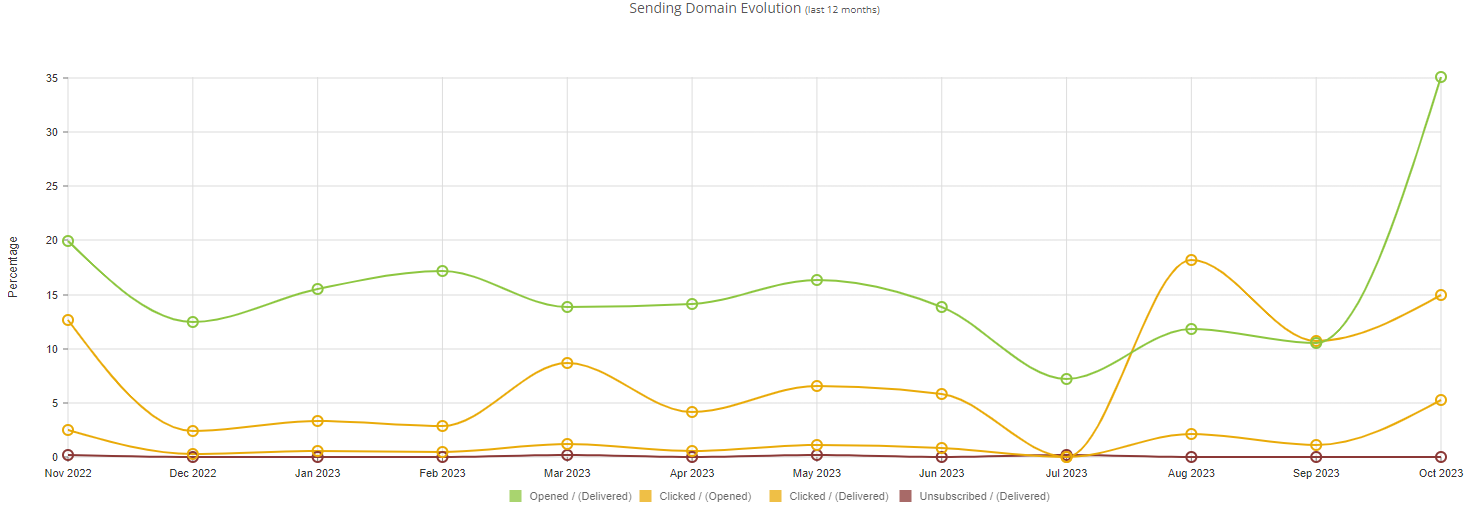
The second graph allows to observe the evolution of the percentage of opened emails (out of the delivered ones), clicked emails (out of opened emails), clicked emails (out of the delivered ones) and unsubscribed emails (out of the ones delivered) on a 12-month period.
The Deliverability tab
This second tab focuses on deliverability analytics.
1. Bounces
At the top, you'll have the opportunity to see a summary of the bounces on this sending domain. These numbers are not submitted to the date filter.

In this table, you'll find the number of:
- Hard bounces = number of hard bounces
- Domain name unknown (after the @)
- Username unknown (before the @)
- Other type of hard bounce
- Soft bounces = number of soft bounces
- Mailbox of the recipient is full
- Other type of softbounce (e.g. expired message because blocked on the reception domain)
- Spam = number of emails that the Webmail provider considered spam
- Complaints = number of emails that were reported as spam by a profile
2. Domain groups
Below this summary table, you'll be able to observe different graphs. None of these graphs is submitted to the date filter.
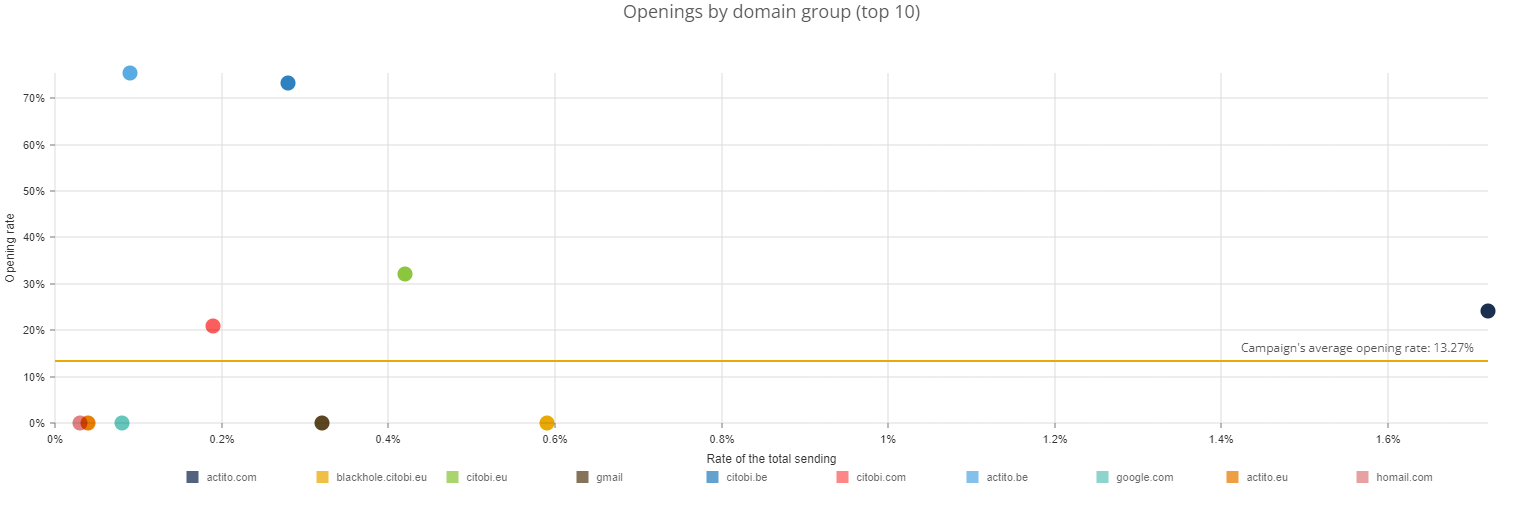
The first graph you'll see reports the openings (%) by domain group. Only the 10 domain groups having the best results are taken into account.
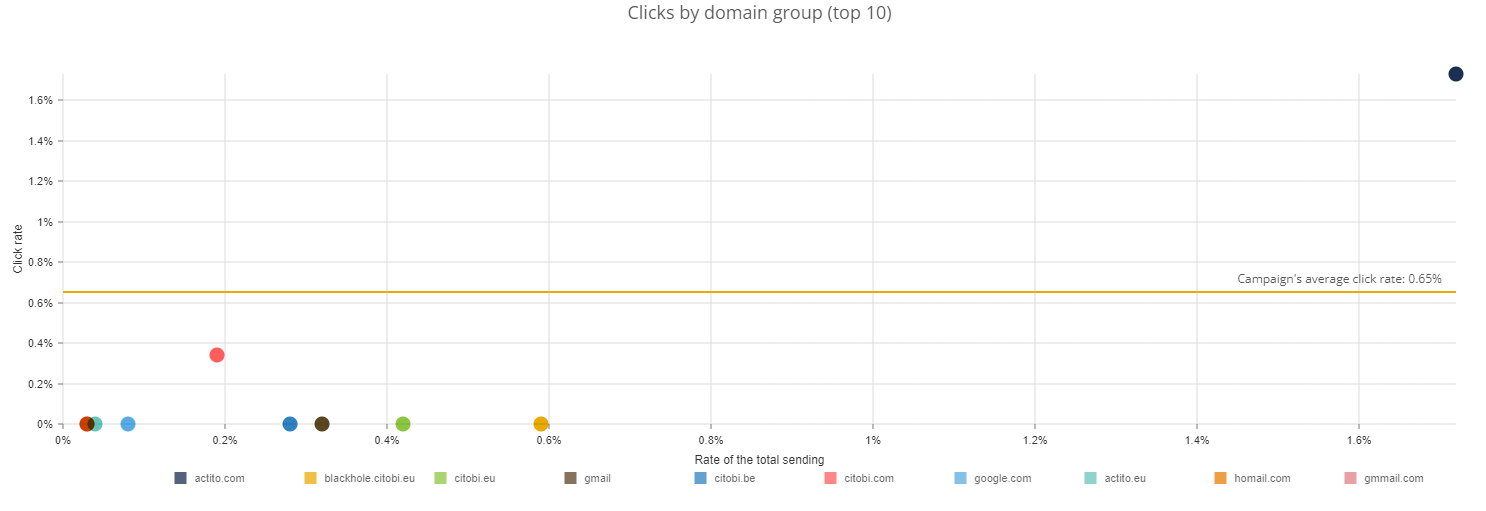
The second graph reports the clicks (%) by domain group. Here again, only the 10 domain groups having the best results are taken into account.
3. Opening details
For the following graphs, you have the possibility to define a filter on a segment, a language and/or a gender.

It should be noted that the report takes into account the segment, the language and the gender at the time the campaign was sent. It does not take into account changes made retroactively.
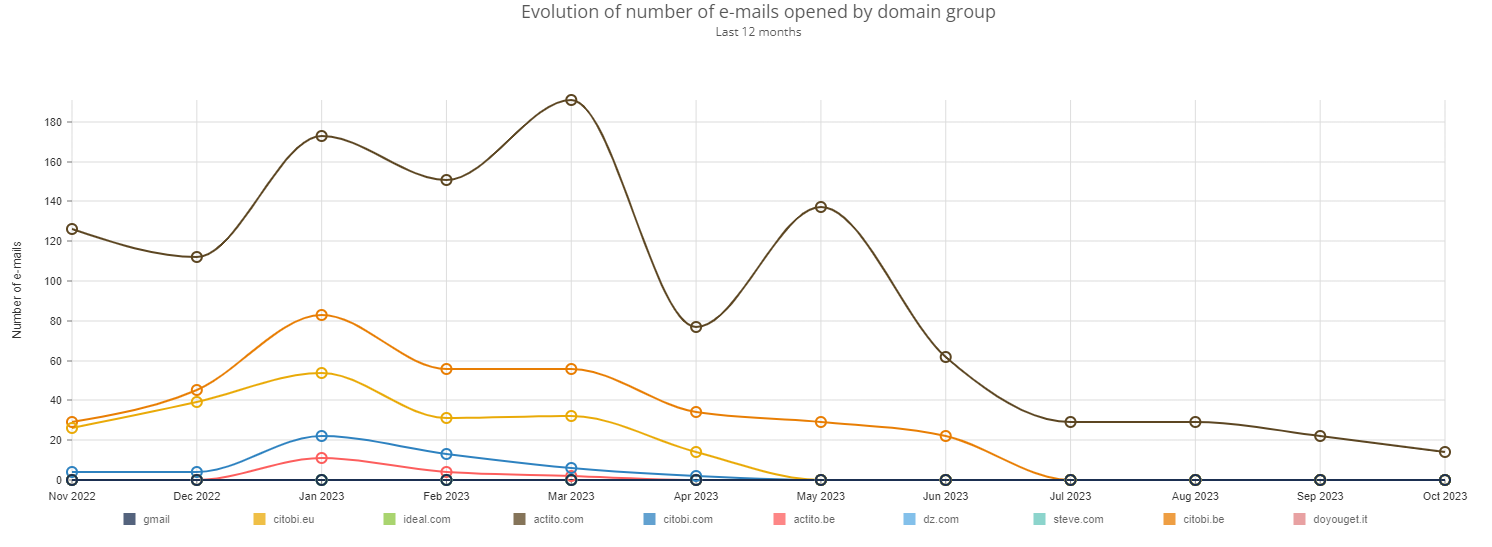
The third graph reports the evolution of the number of emails opened by domain group during the last 12 months.
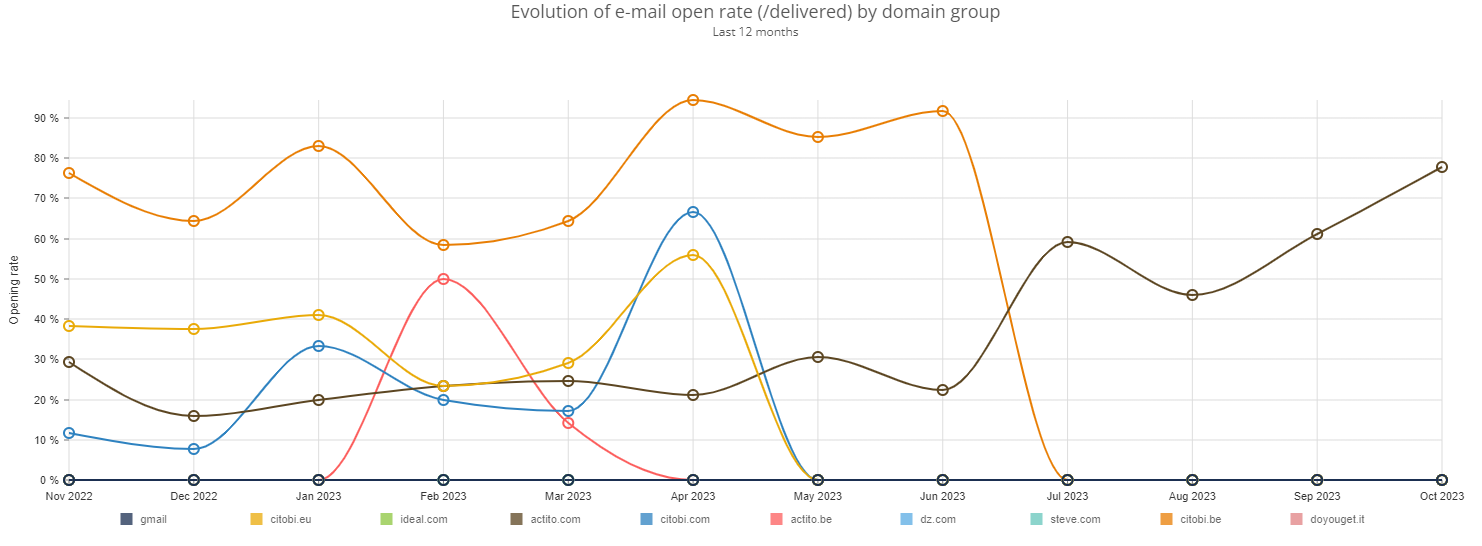
The fourth graph represents the evolution of the email open rate (out of the ones delivered) by domain group during the last 12 months.
4. Click details
Here again, you have the possibility to define a filter on a segment, a language and/or a gender. The changes made retroactively are not taken into account either.
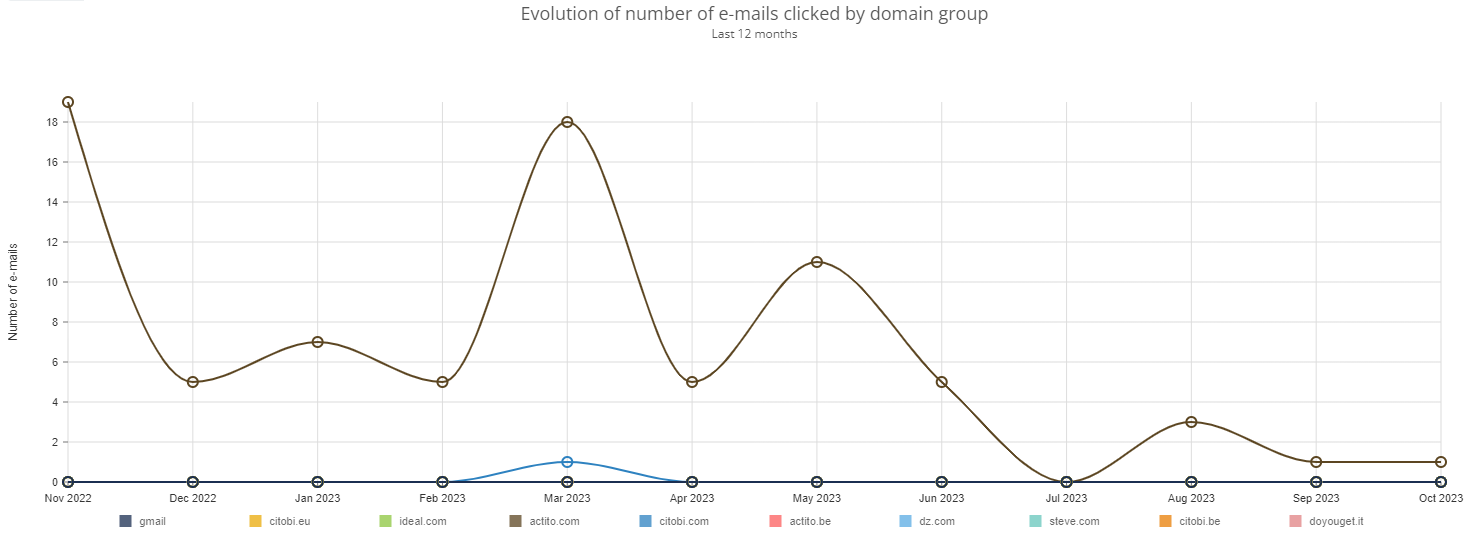
The fifth graph reports the evolution of number of emails clicked by domain group during the last 12 months.
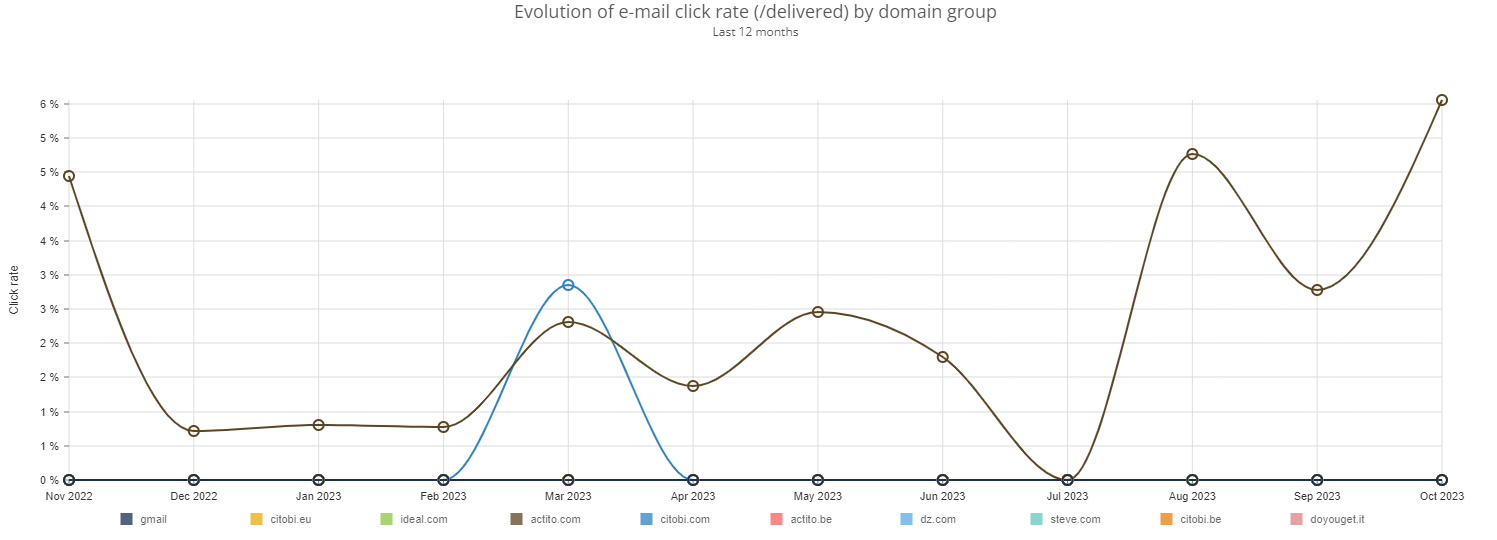
The last graph represents the evolution of the email click rate (out of the delivered ones) by domain group during the last 12 months.
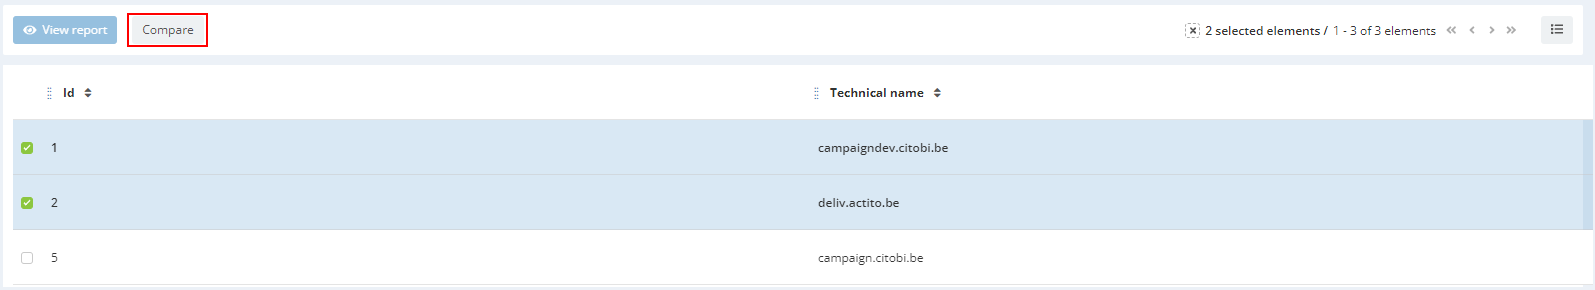
Comparing sending domain reports
For sending domain reports, you also have the opportunity to compare two (or more) sending domains. In the 'View e-mail reports' app, choose the sending domains you would like to compare and then click on 'Compare'.
Just like when you're viewing only one sending domain, you have the opportunity to define a monthly date filter.

The Summary tab
The Summary tab shows aggregated data from the sending domains you chose to compare.
1. Target population, results and sent emails
At the right side of the screen, you will see a graph representing the aggregated rates of sent, delivered, opened and clicked emails of the chosen sending domains.
At the left side of the screen, you will see two tables:
A. Table of aggregated data on the sending domains

You will observe different statuses in this table:
- Targeted profiles = number of profiles in the target
- In error = number of profiles for which the email could not be sent due to an error
- Error when routing the email
- Error when generating an email (e.g. with its personalization, with the rendering of the HTML...)
- Error in one of the parameters of the email
- The target profile is not part of the profile table linked to the email campaign
- The target profile is not part of the targeting of the mailing
- Error of a personalization value
- Limit of non-filtered profiles is reached (for transactional emails)
- Definition of the target of the email campaign is invalid
- Filtered = number of profiles filtered by the Smart filter
- The target profile has no email address
- The profile email address is known, but syntactically invalid
- A duplicate email address
- A complaint has been recorded by a profile
- The domain name of the email address is part of a list of service domain names updated by Actito's deliverability team
- The commercial pressure was activated for this profile
- The email address is temporary quarantined due to encountering bounces. This quarantine is temporary because Actito thinks it is still possible to contact this email address.
- The email address is quarantined permanently due to encountering hard bounces. Actito considers it is not possible to contact this email address anymore and will not try again.
- The email exceeds the maximum size of 4MB set up in order to optimize the inbox loading time
- The profile was randomly filtered in the control group of the campaign
- Net (sent) = number of profiles who did receive the email
This table compares the numbers of these four categories. Each profile is counted only once (unique number).
B. Table of aggregated data on the campaign results from the different sending domains
Here again, you will observe different statuses:
- Sent = number of emails that are sent
- Bounced = number of emails that have bounced
- Delivered = number of emails that have been delivered
- Opened/(Delivered) = number of emails that were opened out of the number delivered
- Clicked/(Opened) = number of emails that were clicked out of the number opened
- Clicked/(Delivered) = number of emails that were clicked out of the number delivered
- Unsubscribed/(Delivered) = number of emails that were unsubscribed out of the number delivered
- Complaints/(Delivered) = number of emails that were marked as spam out of the number delivered
As in the previous table, profiles are counted only once.
You can also view more precise results. For example, you can view the results of the profiles depending on the segment they belong to, the language they speak or their gender. For that, switch on the filter in the upper part of the screen and choose your wished action.
It should be noted that the report takes into account the segment, the language and the gender at the time the campaign was sent. It does not take into account changes made retroactively.
2. Sending domain evolution
Below these tables and the graph, there are two other graphs about the aggregated sending domains evolution. These graphs are not submitted to the date filter, they take into account the last 12 months.
The first graph allows you to observe the evolution of the number of emails sent, bounced, delivered, opened, clicked and unsubscribed on a 12-month period.
The second graph allows to observe the evolution of the percentage of opened emails (out of the delivered ones), clicked emails (out of opened emails), clicked emails (out of the delivered ones) and unsubscribed emails (out of the ones delivered) on a 12-month period.
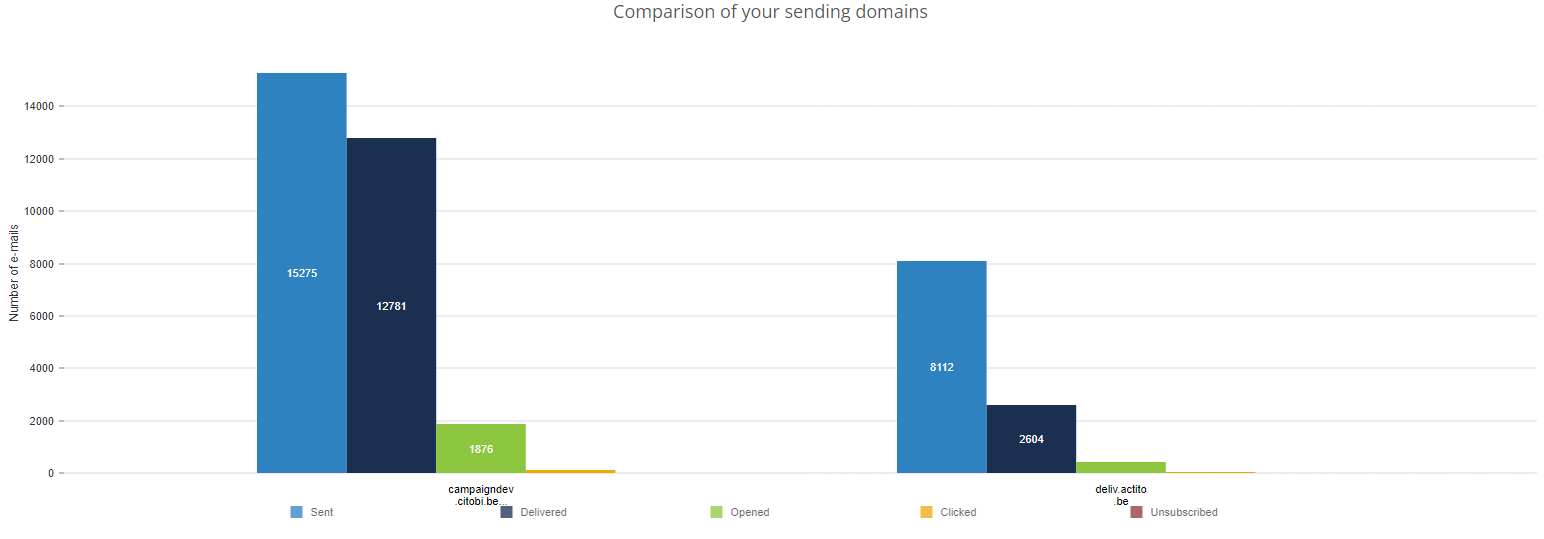
The Comparison tab
The Comparison tab allows you to observe four graphs. The first one allows you to compare the number of emails sent, delivered, opened, clicked and unsubscribed through the different sending domains.
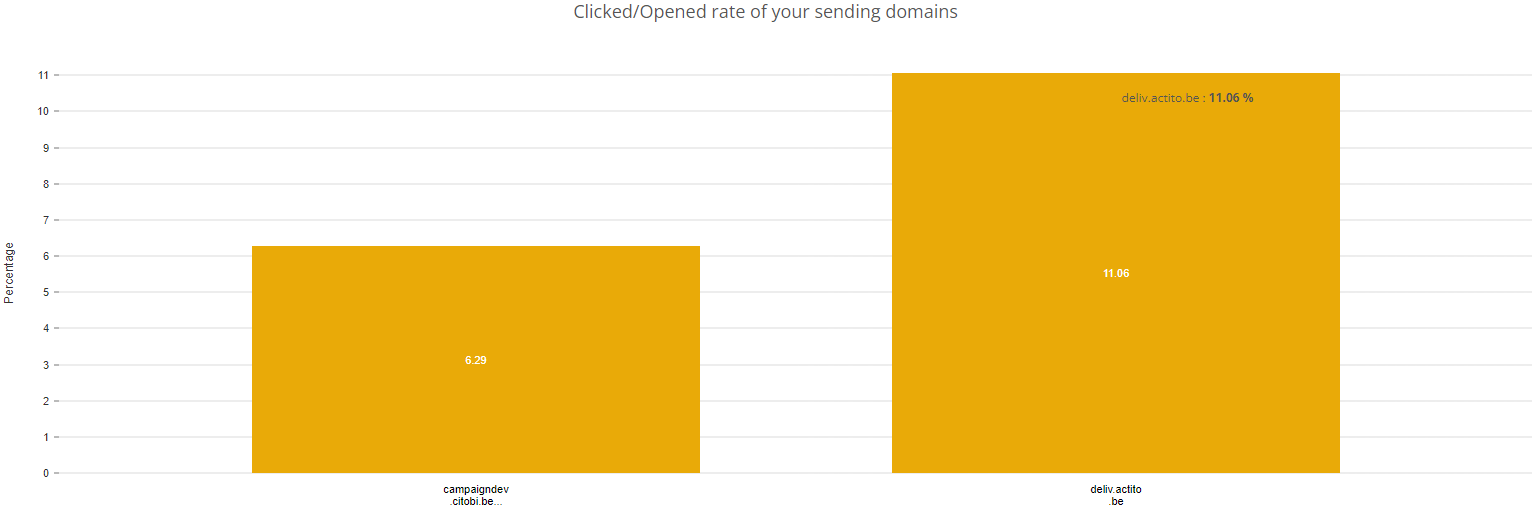
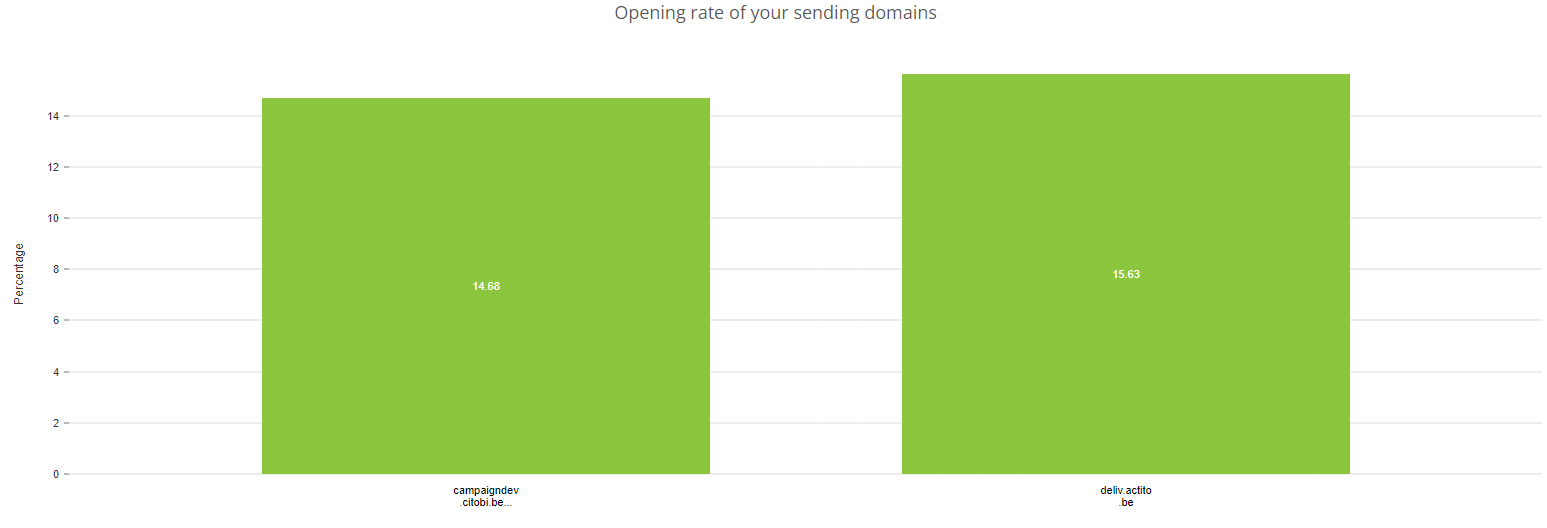
The second graph allows you to compare the opening rate of the sending domains you chose.
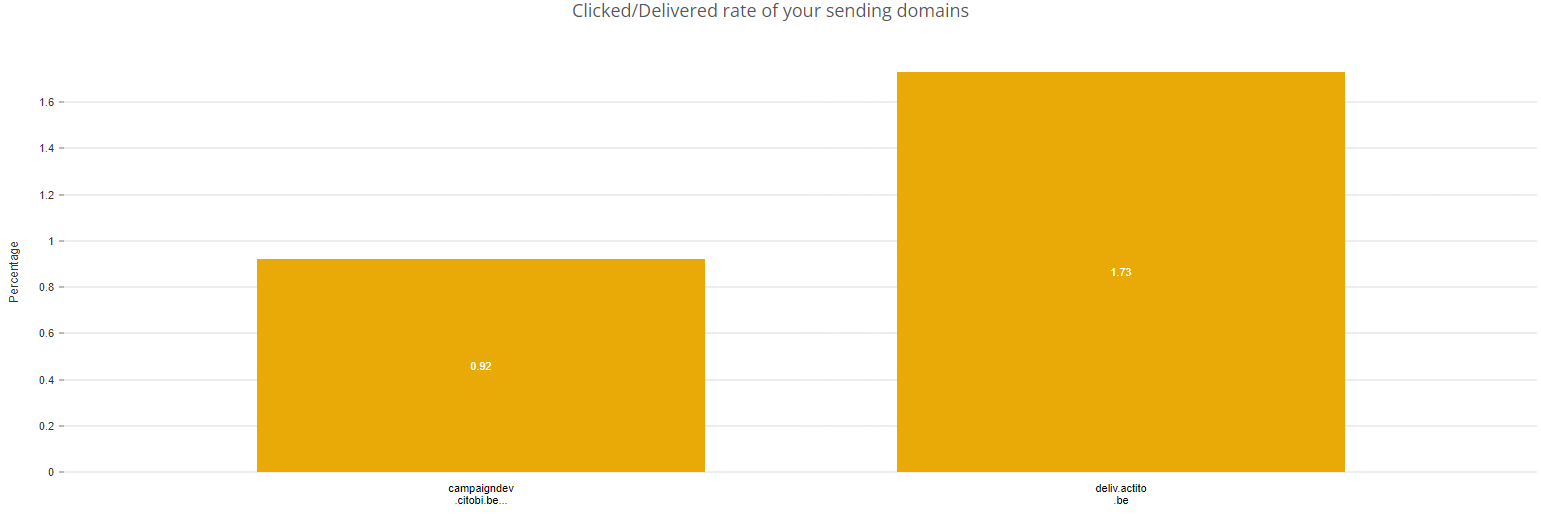
The third graph allows you to compare the number of emails that were clicked out of the ones delivered of the different sending domains.
The last graph allows you to compare the number of emails that were clicked out of the ones opened of your different sending domains.