In-App report
To view the report of an In-App campaign, go to the In-App campaigns reports module (Hub > Reporting > In-App campaigns reports).

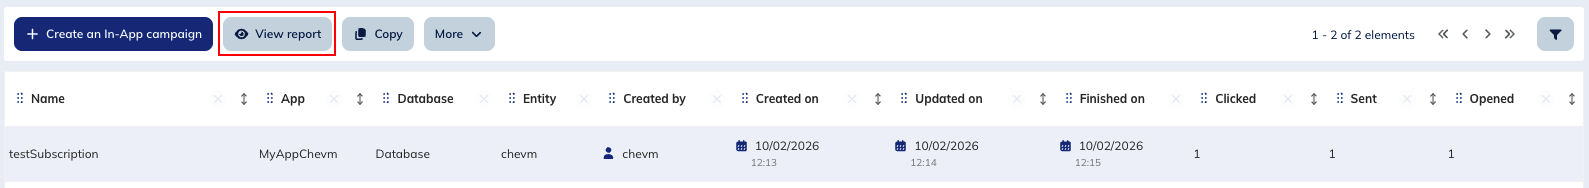
You can also access a campaign report from the "In-App campaigns" module. Select the relevant campaign and click on "View report".
The In-App campaigns reports module enables you to see the reports for all your in-app campaigns.
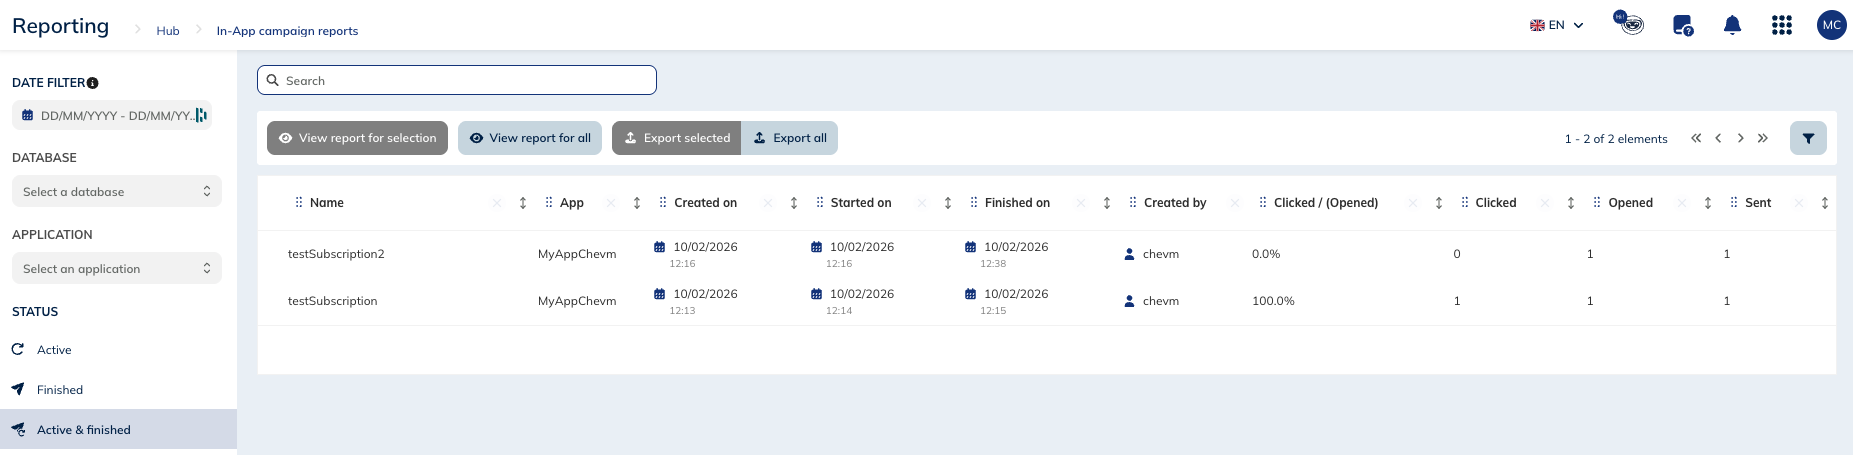
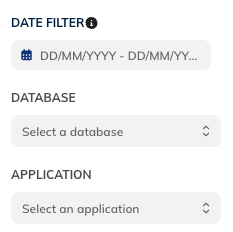
You can filter the reports based on:
- a date filter
- a profile table
- an application
You can also view them based on their status:
- Active
- Finished
- Active & finished

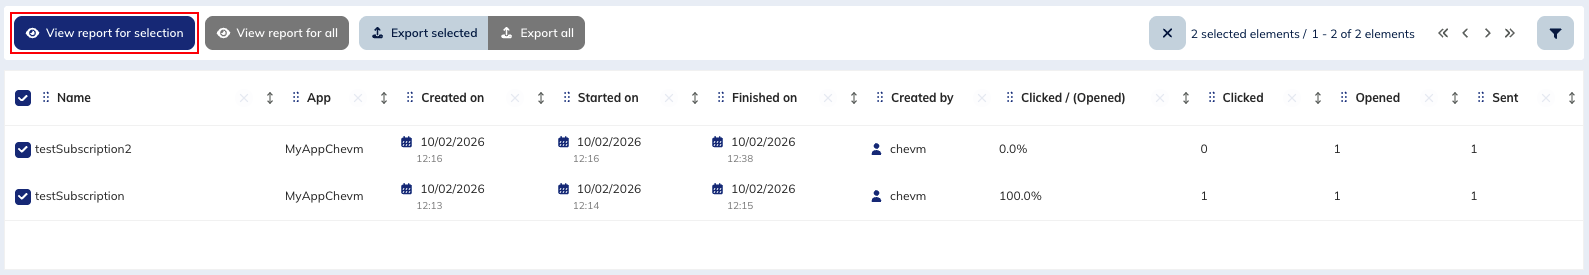
To access a campaign report, you just need to find the campaign whose report you would like to view, select it and then click on "View report for selection".
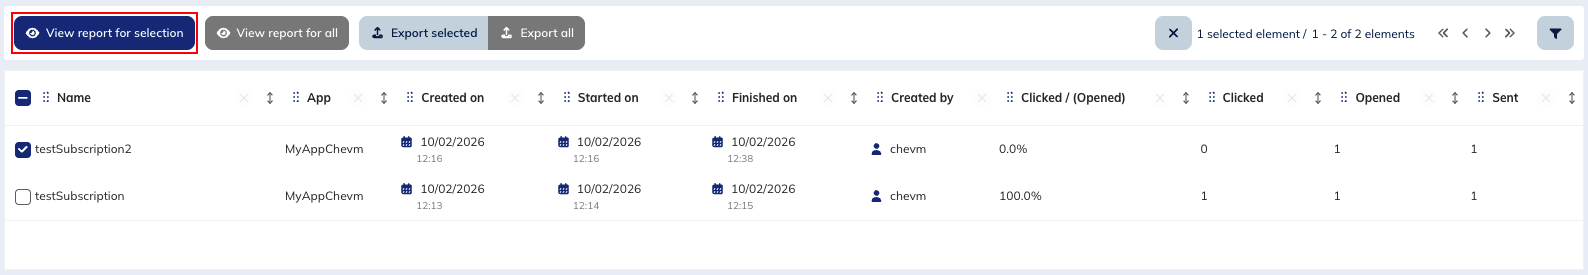
You also have the possibility to select several campaigns in order to have a consolidated report for the selected campaigns.
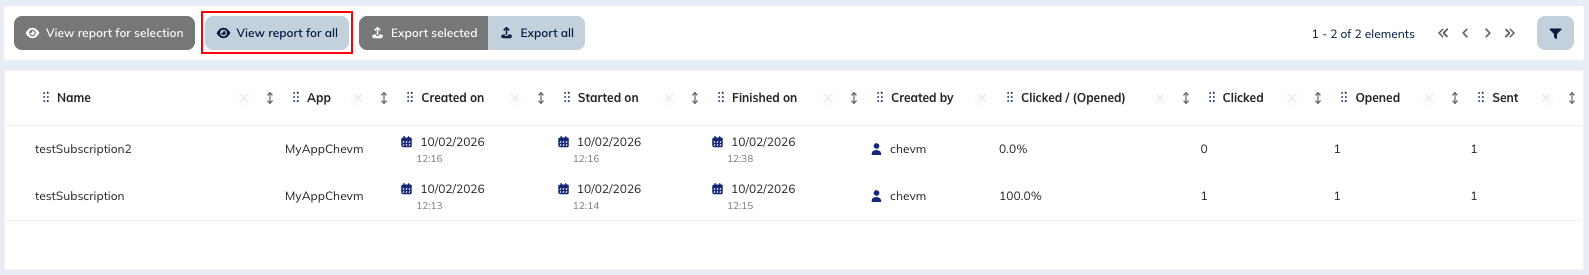
And if you don't select any campaign, you have the opportunity to view a report for all of the campaigns that are complying with the selected filter.
Understanding in-app campaign reports
Actito reports contain different type of information, including information on targeting, opening, clicks and a general summary of your sending results.
In the upper tab, a breadcrumb displays the name of the campaign.
Summary tab
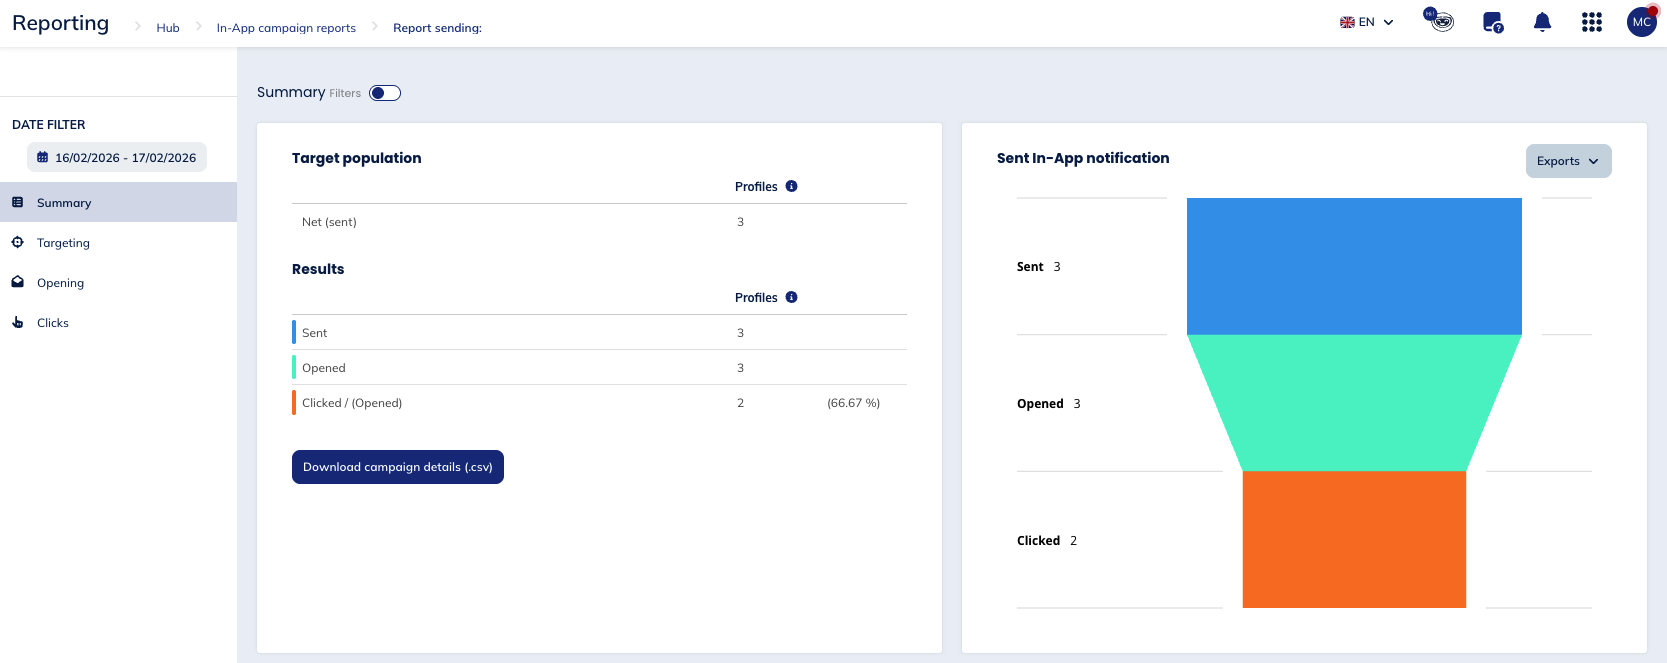
Note that you have the opportunity to add a filter for this tab, based on a segmentation, a language and a gender.

Target population
This table shows the number of in-app campaigns that have been sent.
Results
This table shows the number of in-app campaigns sent, opened and clicked:
- A sent in-app campaign is a campaign that has been sent to the profiles device
- An opened in-app campaign is a campaign that has been displayed in the profile's native app or website
- A clicked in-app campaign is a campaign a user has interacted with by clicking on an action it contains
You can download these campaign details in a .csv file.
Sent In-App notification
The funnel chart that shows the different stages of an in-app campaign: the number of campaigns sent, opened and clicked.
You can export this diagram as a .csv, .svg and to print it as a chart.
Campaign evolution
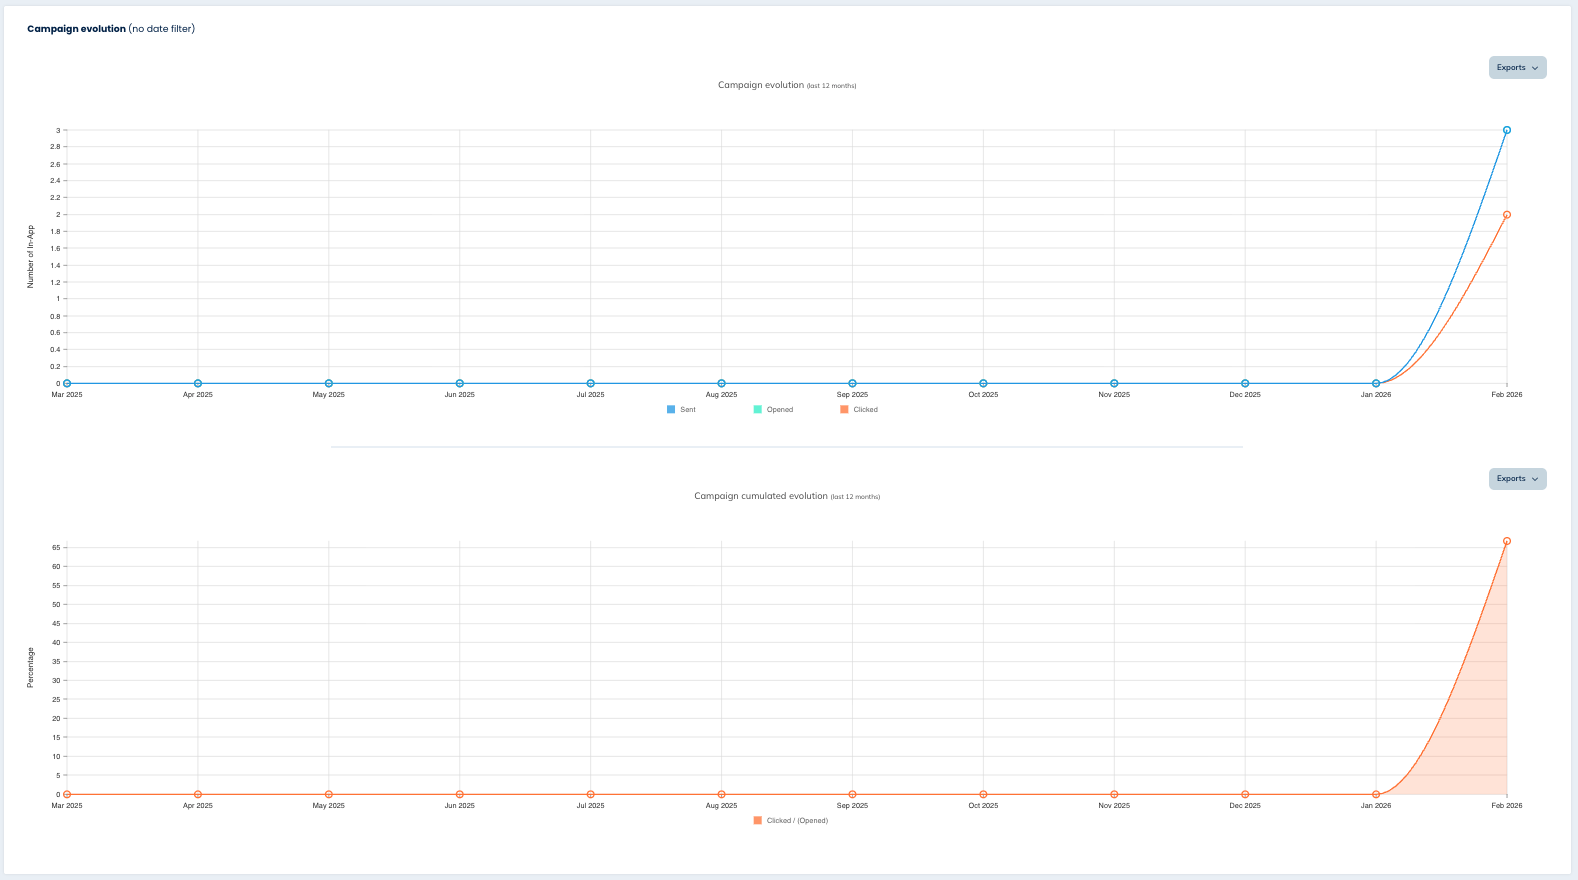
These two graphs show the evolution of the campaign over the last 12 months according to:
- the absolute number
- the percentage
Targeting tab
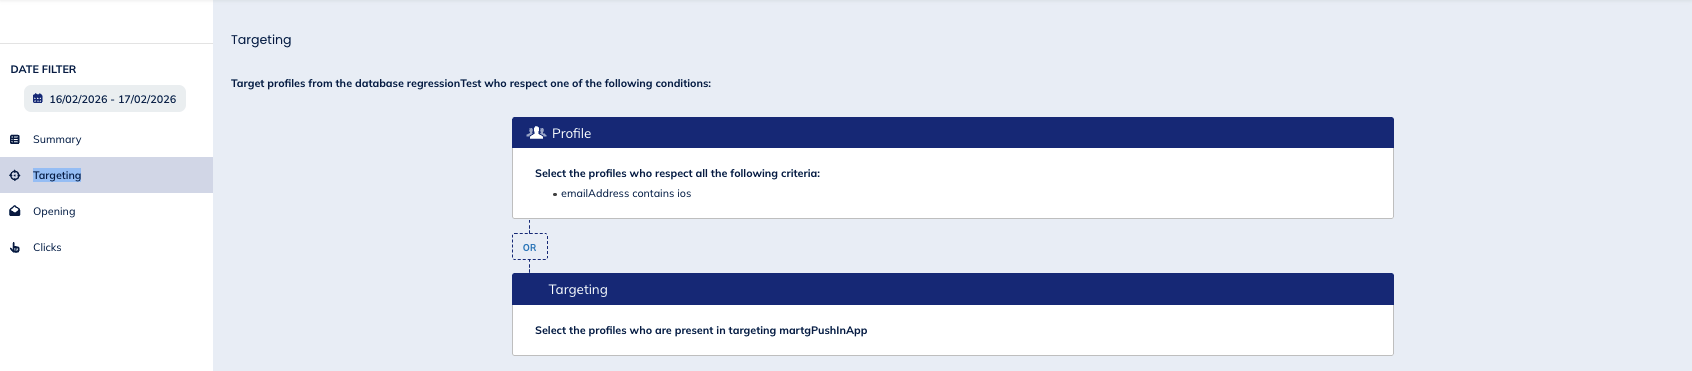
In this tab you can review the targeting conditions that were defined for the campaign.
Opening tab
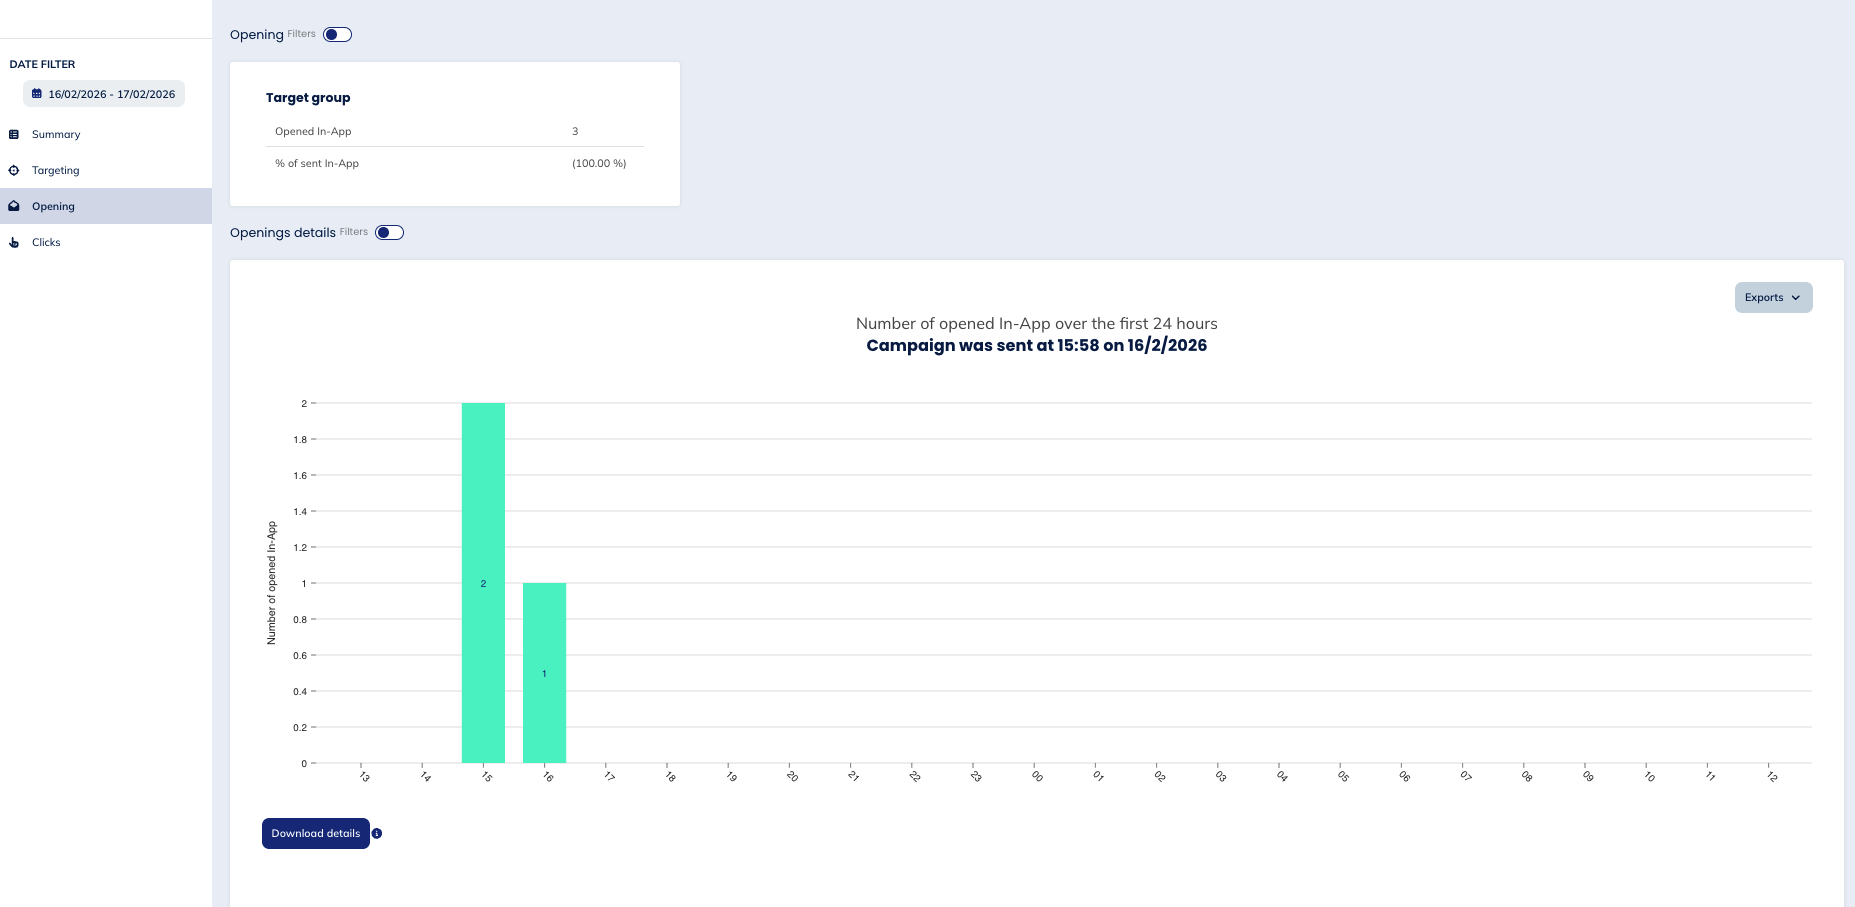
Note that you can add a filter for this tab, based on a segmentation, a language and a gender.
Target group
The first table that you will see in this tab offers you a comparison between the total number of opened in-app campaigns and the percentage of opened campaigns over the sent ones.
Opening details
These graphs show you, on the one hand, information about the number of opened push over the 24 hours the campaign was sent and, on the other hand, about the opened campaigns over the last 10 days.
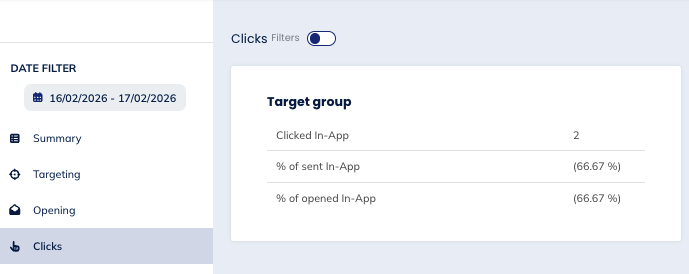
Clicks tab
 $
$
This table shows the number of campaigns clicked at least once and compare it to the percentage of sent and opened in-app campaigns.
Targeting on in-app recency
Actito collects, in the "Profile" module, global information about the engagement score of a profile and its behavior in the various communication channels of Actito, among others, if an in-app campaign was sent to the profile and if he has clicked or opened an in-app campaign.
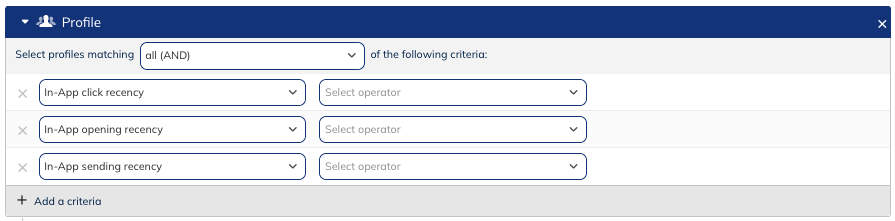
Therefore, thanks to this piece of information, you can select profiles for which the following interaction has been recorded:
- click recency: a profile that has clicked on one of the actions contained in the in-app message
- opening recency: a profile that has opened an in-app message
- sending recency: a profile to which an in-app message has been sent